Finance Benchmarking Report
Benchmarking Report Bundle


Finance Benchmarking Report
Benchmarking Report Bundle
Which metrics, or KPIs, are included in this report?
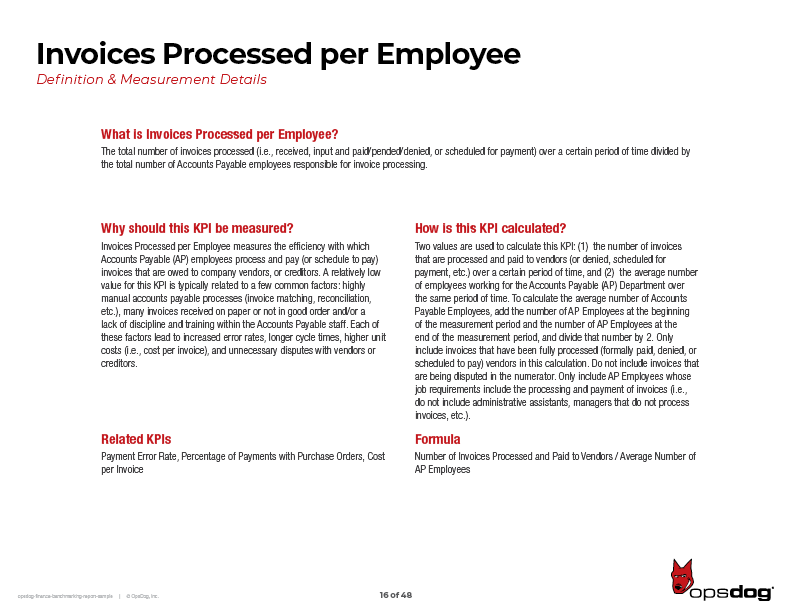
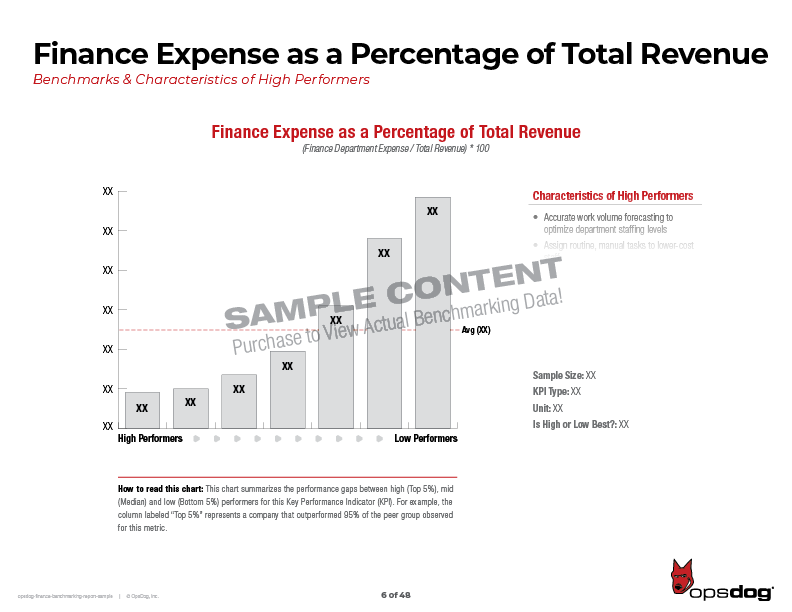
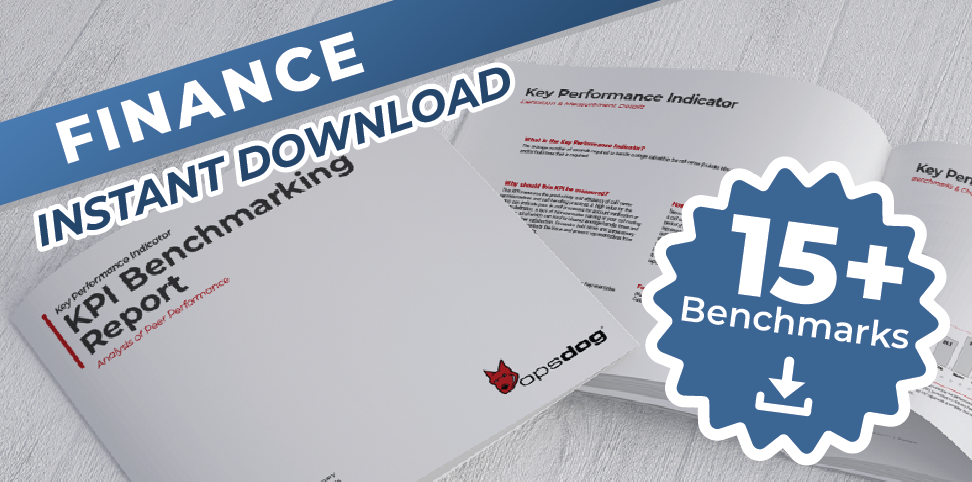
This 48-page benchmarking report includes benchmarking data for 19 Finance Department performance metrics, or KPIs, including Days Sales Outstanding (DSO), Invoices Processed per Employee, and more. Each KPI in this report includes a chart outlining high-to-low performer data, a detailed KPI definition, calculation instructions and a summary of high-performing company attributes. Stop operating in the dark - benchmarking is a major step in identifying potential improvements within any Finance Department. This report will give you a head start that you can't find anywhere else.
- Accounts Receivables Beyond 60 Days
- Cost per Invoice
- Cost per T&E Report Processed
- Days Sales Outstanding (DSO)
- Finance Expense as a Percentage of Total Revenue
- Finance Staffing Ratio
- Financial Close Cycle Time
- Invoices Processed per Employee
- Payroll Staffing Ratio
- Percentage of Invoices Received as PDFs
- Percentage of Invoices Received on Paper
- Percentage of Payments with Purchase Orders
- Percentage of T&E Checks Reissued
- T&E Expense Payments per Employee
- T&E Payment Error Rate
- T&E Voucher Error Rate
- Vendor Invoice Error Rate
- Vendor Payment Error Rate
- Vendor Payment Processing Cycle Time
Click to See More
Click to See less
Frequently Asked Questions
-
Q: How do you collect and validate your data? +
-
Q: How much information will my Benchmarking Report contain? +
-
Q: How often do you update your reports? +
-
Q: Your download-able reports look great. But I need something custom. Can you help? +
Related Products
Let us take your KPIs & business intelligence efforts to the top.
Contact us now to discuss a BI engagement with OpsDog.
Contact OpsDog
If you would like information on this product please enter your email below.