What is a Process Flowchart? How are They Used in Business?
A process flowchart is a visual representation of the steps within a business procedure, such as shipping a product or setting up new clients, that serves businesses with many uses. These diagrams detail the "who," "what," "when," "where," and especially the "how" of any process through an easy to read chart. Flowcharts are critical to the success of business operations across the world and have been since their widespread introduction as a business strategy in 1921.

Let us take your KPIs & business intelligence efforts to the top.
Contact us now to discuss a BI engagement with OpsDog.
Contact OpsDogAlso referred to as a Business Process Map or Business Flow Chart, these diagrams can be used to document a current business process, model potential changes or a test new operation altogether. Process flowcharts make it easier and faster for team members to gain a detailed understanding of a procedure, to simplify or improve the efficiency of the operations, and to generally increase the results of the business process.
Process Flowcharts by Industry
Business Functions
-
Support Group Operations
-- 344Finance
- 245Human Resources
- 230Information Technology
- 372Marketing
- 70Legal
- 93Compliance
- 165Shared Services
- 16Risk Management
-
General Line Groups
-- 150Call Center
- 150Customer Service
- 162Product Development
- 102Collections
- 300Sales
-
Supply Chain Operations
-
Industries
-
Financial Services
-- 966Banking
- 229Insurance
- 130Mortgage Lending
- 428Investment Management
- 445Broker Dealer
- 235Consumer Finance
-
Healthcare
- -
Other Services
-- 118Utilities
- 65Print Publishing
- 68Broadcast Media
- 263Advertising
- 90Retail
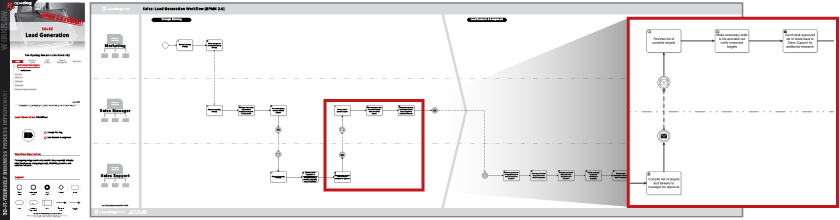
Sales Flow Chart Example
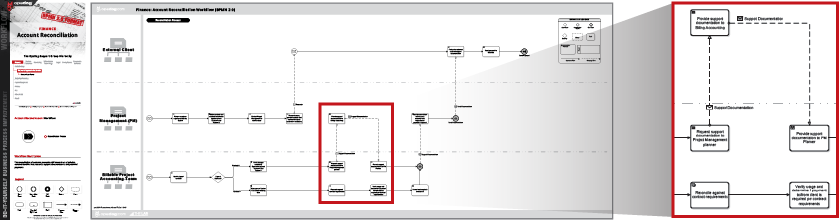
Finance Flow Chart Example
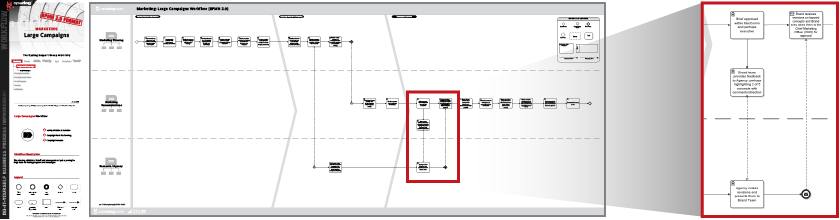
Marketing Flow Chart Example
How to Develop & Use a Process Diagram, or Flowchart (Step-by-Step)
Developing a flowchart model for your business process may require large amounts of information, but the overall strategy is relatively straightforward when you follow the right steps. Follow the steps below in order to create a detailed and professional appearing diagram from scratch.
Step 1: Identify the Process
-
Start by clearly defining what you’re mapping out and why. What is the process? What is the problem? What do you aim to gain from developing this diagram? Make sure the scope of your project is appropriate for your goals, and likewise that your goals are appropriately realistic for your process.
Step 2: Brainstorm and Plan
-
Sequence and details aren’t important at this stage, but generally listing the major steps and people involved within the process will make things go much smoother when you go to gather more information later. At this stage you can also determine your parameters such as what level of detail to expect and who will do what, when.
Step 3: Gather More Information
-
Observe, study and record all of the steps involved in the process. Keep filling in the blanks up to par with your necessary level of detail, capturing all of the "who," "what," "when," "where" and "how." While you continue to dig deeper and break down the process into more specifics, you may want to consider some of the following questions:
- What is the overall goal of the process?
- What triggers the start of the process?
- What signals the end of the process?
- What inputs does the process require?
- What are outputs of the process?
- Who is involved in which operations?
- Are there any alternate steps or routes in the process?
Step 4: Interview Participants and Stakeholders
-
As you continue gathering details of your business process, you’ll want to speak with the people directly involved with each step. This part of your mapping strategy is significantly useful to understand exactly what these teammates are doing and uncovering inefficiencies and miscommunication that are slowing the entire process down.
Step 5: Determine Sequence of Events
-
Using all the information you’ve collected so far, write out the sequence of the steps for your process: what’s sequential, what’s simultaneous, and how is each step ordered. You can be precise and detail each step numerically or show general flow.
Step 6: Start Creating your Flowchart Using the Correct Symbols
-
Use simple shapes, called the Business Process Modeling Notation (BPMN), to show the different steps and flow of your process.
- Arrows: Show flow and direction of each step through the process.
- Ovals: Show either the start or the end of the process.
- Rectangles: Show the action or operation for that step.
- Parallelograms: Show inputs and outputs that are part of the process.
- Diamonds: Notifies a step where action is required to make a decision. These decision boxes often have multiple arrows coming out of them, usually labeled yes and no, or appropriately otherwise.
Step 7: Finalize, Analyze & Act
-
Have all the stakeholders and related personnel (supervisors, team members, suppliers, customers, etc.) review the process diagram you've developed to make sure everyone agrees. Don’t forget to include important reference information, like a title and date of the operation, and save the flowchart with your business process mapping software.
Now that you have a workflow chart to use as a basis for in-depth analysis and interpretation of your business process, you can begin to ask questions like:
- Is this process meeting our expected goal?
- Are team members following or will they follow the process correctly?
- Is everyone in agreement with the process map content and flow?
- Are required decisions being made timely and effectively?
- Are any steps of the process redundant or missing?
- How can we make the overall process, or individual actions, perform better?
Asking and answering these questions becomes much more straightforward with a detailed diagram to work from. Plan appropriate actions to make improvements or to test changes to your business process, but don’t forget to make adjustments to your workflow diagram as well.
The Different Types of Flowcharts for Business
Flowcharts are as unique as you and your business. While the variations are practically endless, there are, however, four types we can name that are particularly versatile and useful for describing business process across a wide range of function and goals.
- Process Flowcharts
Process flowcharts diagram higher levels of a process without focusing on small details or components. These flowcharts are some of the most commonly used charts in businesses because of their ability to be applied to virtually any process. From detailing the structure of roles and responsibilities within an organization to mapping the process of proposing and enacting new events or projects, the applications are endless. - Cross-Functional Flowcharts
Also called Deployment Flowcharts, these flowcharts focus on the lower levels of a business process. While process flowcharts avoid including much extraneous detail, cross-functional diagrams display some of the highest levels of detail, specifying business process executions, the participants and their interactions within the process. This chart uses several columns behind your symbols to make it easier to track who is connected to which part and when. - Swimlane Flowcharts
Swimlane flowcharts help describe how separate groups, employees or processes interact. Often in business one process may be fulfilled or reliant on multiple people at the same time, which can make it difficult to define specific reasons for delays and errors within the operation. Swimlane diagrams help represent systems with simultaneous interactions. - Data Flowcharts
Data flowcharts specifically show the way data travels within a business. Usage of these diagrams is common with information based businesses, whether that’s physical documents or digital. This type of graph is especially useful when designing or analyzing the flow of information in software, but can be used to analyze any flow of information, such as a sales funnel.
As a general rule, despite the type or the purpose of the diagram any business flowchart should follow the Business Process Modeling Notation (BPMN), which is the standardized graphical notation of all business processes within a workflow. This standard simplifies the understanding of business activities and helps bridge the communication gap between design and implementation.
Let us take your KPIs & business intelligence efforts to the top.
Contact us now to discuss a BI engagement with OpsDog.
Contact OpsDogCommon Flowchart Software Applications
Due to the significance of flowcharts to so many business operations around the world, the market for applications that manage and build flowcharts is quite competitive. There exists a large number of applications and services that offer businesses many competing features to fulfill the workflow diagram needs specific to them. Here we’ve compiled some of the most popular tools that cover a wide-range of features and budgets:
- Lucidchart
Lucidchart is a popular flowchart application that balances form, function and affordability. With a smooth user interface and tools for team collaboration, it's easy to create a professional looking diagram in very little time. Lucidchart offers multiple tiers of service to their software, including a highly limited but free account version. - Microsoft Visio for Office 365
Visio was one of the earlier software applications to simplify the process flowchart creation process, and under Microsoft has continued to offer some of the most powerful and expansive, as well as expensive, services in the market. While hosting a wide array of options, Visio works best for businesses already with some level of IT support since the setup isn’t quite as simple as most other services. - SmartDraw Cloud
SmartDraw Cloud offers one of the easiest to use applications at a higher price tag, to compete with Visio. It uses a large selection of objects and features, but somewhat lacks when it comes to teammate collaboration features and can’t export in Visio format as well. - Creately
Creately isn’t as fancy as most other flowchart application options, but it isn’t as expensive as most of its competitors either. It’s user-friendly yet basic, but its biggest drawback comes from its limited template selection. These details make Creately more ideal for businesses on a budget that are looking to acquire their flowchart templates elsewhere. - Draw.io
While not necessarily the most robust flow chart diagramming application, Draw.io does offer perhaps the best free service. Draw.io’s primary strength lies in its excellent integration with Google Drive, and while the service does provide a paid version with expanded features, the overall software lacks in comparison to several other applications. - OpsDog
OpsDog provides some of the top process workflow templates across over 200 business processes, from customer account opening to employee-on-boarding and many more. This template library also includes personalized and custom created templates specific to your business. OpsDog’s templates are available in all popular workflow formats (PDF, Visio and PPT) so you can get a head start while using your favorite workflow application software.
Let us take your KPIs & business intelligence efforts to the top.