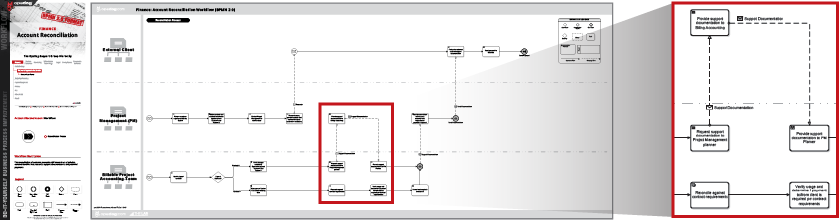
What is a Finance Flow Chart, or Workflow?
Finance department employees perform hundreds – or thousands – of activities each day. These activities can be connected to form a business process, or workflow, that produces an output of some sort. In finance, these outputs could include a financial report, invoice payment, internal audit or account reconciliation. There is a specific set of activities that finance employees follow to produce these outputs, or “work products.” The sequential, visual representation of those activities is called a finance a flow chart, or process map. These maps can be used to improve finance processes, or help automate repetitive, transactional activities.
Let us take your KPIs & business intelligence efforts to the top.
Contact us now to discuss a BI engagement with OpsDog.
Contact OpsDogHow to Use Finance Flow Charts & Workflows to Improve Operations
Improving business processes within the finance department starts with understanding how the work is currently being done. Mapping efforts should start with the high volume, high value finance processes – AP/AR, financial close, financial reporting. Interview process participants to capture and validate details about the workflows. Once a complete process map has been developed, identify and document possible process improvements. Improvements can be categorized into a few groups – “quick wins,” near-term and long-term opportunities. Once the map and the improvement opportunities have been fully documented, the hard part begins – future state process implementation and change management.
Finance Process Mapping and Flow Chart Analysis: The End-to-End Value Chain for Finance
Finance business processes center around the management, analysis and reporting of financial data. This includes recording credits and debits in the company’s general ledger – and appropriately categorizing these data to allow for accurate financial planning, forecasting, analysis and reporting (both internal management reporting and regulatory reporting). At a high level, finance function activities can be divided into a repeatable value chain:
Billing (Inbound Payments): The company collects payments from customers and other entities.
Accounts Payable (Outbound Payments): The company pays vendors and other entities.
General Ledger Management: Financial data (credits and debits) flow into a central accounting repository for analysis.
Financial Reporting: The company reports financial data to internal (managers, executives) and external parties.
Budgeting & Forecasting: The company plans future activities based on historical financial data.
Take a bite out of inefficiency with custom business intelligence from OpsDog

Best practice = Biggest transformation. Custom business intelligence dashboards from OpsDog.

Unleash the power of business intelligence today!
Select an industry.
-
Support Group Operations
-- 344Finance
- 245Human Resources
- 230Information Technology
- 372Marketing
- 70Legal
- 93Compliance
- 165Shared Services
- 16Risk Management
-
General Line Groups
-- 150Call Center
- 150Customer Service
- 162Product Development
- 102Collections
- 300Sales
-
Supply Chain Operations
- -
Financial Services
-- 966Banking
- 229Insurance
- 130Mortgage Lending
- 428Investment Management
- 445Broker Dealer
- 235Consumer Finance
-
Healthcare
- -
Other Services
-- 118Utilities
- 65Print Publishing
- 68Broadcast Media
- 263Advertising
- 90Retail
Let us take your KPIs & business intelligence efforts to the top.