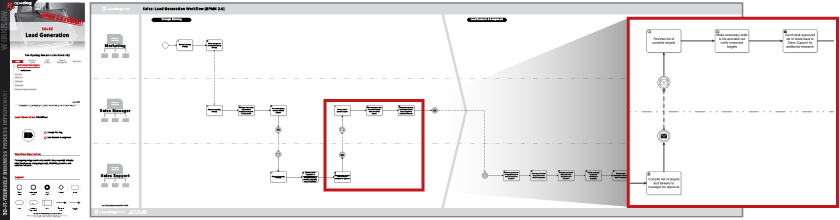
What is a Sales Process Workflow, or Flow Chart, Overview
Sales operations employees perform a myriad of process steps and work that together form a cohesive sales work flow. Sales process flowcharts are a visual representation of the combined efforts of the sales group that can be visually reviewed, understood, and aid sales operations teams in generating more revenue. Sales operations work flow analysis can be used to speed up lean improvement efforts, traditional automation, as well as newer forms of process improvement like robotic process automation. The final outputs of workflows in sales most commonly include: purchase orders, sales prospects, and new contracts in a system.
Let us take your KPIs & business intelligence efforts to the top.
Contact us now to discuss a BI engagement with OpsDog.
Contact OpsDogHow to Create Sales Process Flow Charts for Process Improvement, Compliance Reasons, or Automation
To improve or automate sales processes, business unit leaders must first document and understand how current state processes operate. Documented sales process workflows enable those conducting process analysis to uncover hidden inefficiencies, compliance risks, and improve the department according to business goals. The best place for sales flow chart analysis efforts is with sales processes that are high volume and are closest the customer. Starting points for your sales flow chart creation efforts can include lead generation and research, sales meeting processes, product demos, purchase order creation, quote generation, and closing activities. Once you have the basic steps down, then you can visualize the sales department’s sales pipeline or funnel. When a complete sales process map is developed, identifying and documenting potential process improvements becomes easier. A few questions to consider when creating a sales workflow should be:
Are leads first contacted through email, phone, social media, or in person?
Does the current process include time for product demos? Do demos take place othrough video calls, phone calls, in person? Does this sales process need a demo at all?
Was there a follow up scheduled in the sales process?
Identifying the End-to-End Value of Sales Process Mapping and Flow Charts
At their core, sales business processes deal with identifying leads, researching their needs, offering the products/services that will appeal most to them, and closing the sale. Often, this includes recording potential sales leads and categorizing them in terms of quality and number of follow-ups. High-level sales process flow charts can be divided into a value chain such as this:
Lead Generation and Research: The company develops a targeting strategy and identifies potential sales leads based on it and additional research.
Qualify Leads: The company assesses current leads to determine if further actions should be taken. This typically involves assessing whether leads can afford to purchase a product, how willing leads are to give their time, and if they’re willing to go through a demo.
Demonstrate Value: Using demos, presentations, or other avenues, the company shows the lead how their product will help them.
Guide Leads’ Understanding: The company must anticipate any potential questions or objections, and have a business process in place to guide leads to the end of a purchasing decision.
Deliver and Support: Sales management continues after closing a sale, with certain business processes in place to provide continual support and increase customer service satisfaction.

Select an industry.
-
Support Group Operations
-- 344Finance
- 245Human Resources
- 230Information Technology
- 372Marketing
- 70Legal
- 93Compliance
- 165Shared Services
- 16Risk Management
-
General Line Groups
-- 150Call Center
- 150Customer Service
- 162Product Development
- 102Collections
- 300Sales
-
Supply Chain Operations
- -
Financial Services
-- 966Banking
- 229Insurance
- 130Mortgage Lending
- 428Investment Management
- 445Broker Dealer
- 235Consumer Finance
-
Healthcare
- -
Other Services
-- 118Utilities
- 65Print Publishing
- 68Broadcast Media
- 263Advertising
- 90Retail
Let us take your KPIs & business intelligence efforts to the top.