What are Logistics Management Flow Charts?
Logistics management workflows, or flow charts, give a step-by-step depiction of the processes and sub-processes that are necessary for goods to travel through an organization, to the customer. Logistics processes should be well-documented, defined and reviewed on a regular basis in order to achieve cost-effectiveness and meet SLA’s for customer delivery. Each sub-process throughout the logistics management function can benefit from the use of flow charts and process modeling.
Let us take your KPIs & business intelligence efforts to the top.
Contact us now to discuss a BI engagement with OpsDog.
Contact OpsDogThe Benefits of Logistics Management Flow Charts
The value of flow charts and workflows can be realized through a number of areas – logistics planning, transportation, fleet management, last mile logistics etc. Modeling these processes is a great start to improving logistics management productivity and efficiency, which typically results in lower costs and more satisfied customers. Flow charts can be used in countless different ways throughout the logistics management process, but here are a few specific ways that they can be beneficial to your organization:
Perform Standardized Fleet Checks at Regular Intervals: Use flow charts to perform fleet checks (i.e., check tire pressure and treads, radiator checks, power steering fluid, etc.) on company trucks/trailers. These flow charts can act as a useful guide to ensure all necessary items are checked and what to do if an item needs maintenance.
Create Flow Chart to Map Out Last Mile Logistics Journey: Last-mile logistics, or last-mile delivery, is a fairly new, yet very important concept, due to the growing dominance of online shopping. Last-mile logistics costs can be as high as 30-50% of total shipping costs, so logistics managers are focusing on how to navigate this process more effectively. Delivery drivers can encounter a number of issues when delivering packages (e.g., residents aren’t home, locked apartment gate, building security, etc.), so a flow chart that maps out the last-mile logistics process can not only give a blueprint for what drivers should do in certain situations, but it also could help managers identify the areas where most issues are occurring.
Plan Out Deliveries to be As Productive as Possible: Design delivery/pickup routes so that trucks drive fewer empty miles (i.e., miles driven that do not generate income). Flow charts can be used not only to design the routes but also to analyze and review the delivery routes to identify areas of improvement.
Examples of Logistics Management Work Flows and Flow Charts
Logistics management is essential to customer satisfaction, and each component of the logistics process can have a substantial effect on delivery cycle times, order error rates and (as a result) customer satisfaction. Here are the key areas within logistics management that can achieve substantial benefits from process modeling:
Warehousing: The warehousing function is responsible for the receiving, storage, picking and loading of customer orders for delivery. Flow charts and process models can be very beneficial in warehousing operations, particularly cross-docking warehouses where the flow of goods from incoming shipments to outgoing deliveries is standardized, repetitive and well-defined. Flow charts related to cross-docking can help to identify any bottlenecks or inefficiencies that are occurring.
Transportation: The transportation group is responsible for the maintenance of physical transportation assets (e.g., trucks, trailers, etc.) and typically plays a role in the scheduling of pickups and deliveries from distribution centers. Preventative maintenance procedures and fleet checks can achieve significant benefit from the use of flow charts, or workflows.
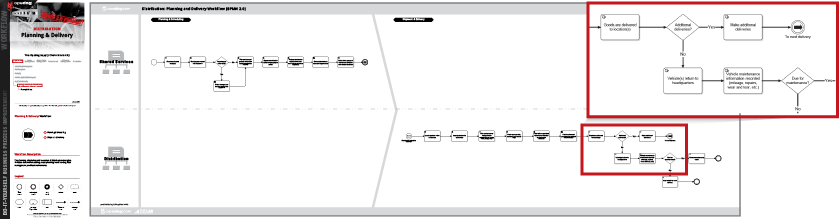
Delivery: This phase of the logistics process refers to the last leg of the order delivery process, which occurs from the time the shipment leaves the company’s warehouse until the shipment is delivered to the customer. Utilize flow charts to improve last-mile delivery operations by mapping out the numerous decision points or situations that a driver can encounter when delivering shipments to the customer.


Select an industry.
-
Support Group Operations
-- 344Finance
- 245Human Resources
- 230Information Technology
- 372Marketing
- 70Legal
- 93Compliance
- 165Shared Services
- 16Risk Management
-
General Line Groups
-- 150Call Center
- 150Customer Service
- 162Product Development
- 102Collections
- 300Sales
-
Supply Chain Operations
- -
Financial Services
-- 966Banking
- 229Insurance
- 130Mortgage Lending
- 428Investment Management
- 445Broker Dealer
- 235Consumer Finance
-
Healthcare
- -
Other Services
-- 118Utilities
- 65Print Publishing
- 68Broadcast Media
- 263Advertising
- 90Retail
Let us take your KPIs & business intelligence efforts to the top.