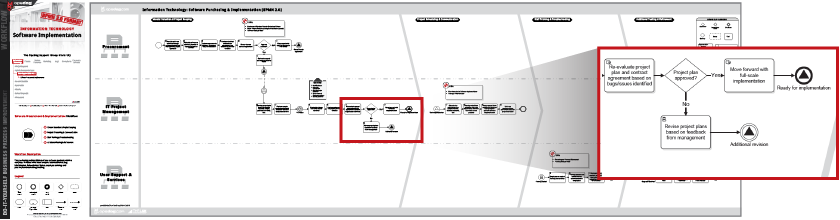
What is an IT Flow Chart, or Workflow?
IT department flow charts, or workflows are a visual representation of the specific activities that occur in order to complete an IT process. There are many sub-processes and steps within the IT function that take place from the time IT employees are planning out their IT infrastructure until those plans reach their end user (IT procurement, network administration, user support, etc.). Mapping out these processes and sub-processes can help to identify bottlenecks and understand dependencies within areas where IT operations can be improved.
Let us take your KPIs & business intelligence efforts to the top.
Contact us now to discuss a BI engagement with OpsDog.
Contact OpsDogRealizing IT Benefits Using Workflows and Flow Charts
An IT department can benefit from the effective use of flow charts, from the designing of applications and infrastructure all the way to end user or help desk support. Creating flow charts for IT processes and sub-processes (in addition to updating them over time) can help an organization achieve significant benefits from service delivery and cost-effectiveness all the way to streamlines help desk operations and improved network security. Here are just a few examples of how those flow charts can be put to good use:
Develop Standardized Process for Security Updates: Create workflows, or flow charts to map out IT security and malware protection. Plan out step-by-step procedures that contains decision points on what devices need security updates or malware scans.
Reference Flow Charts to Aid in Application Development and Deployment: The development of applications in organizations should follow a specific path in order to ensure that all features are working properly and all tests have been completed. Follow flow charts to confirm that all of the necessary activities (bug fixes, patches, enhancements, etc.) to develop and launch new applications have been completed.
Implement Data Storage and Management Processes to Improve Data Quality: Establish standard data structures and formats to make reporting easier and improve the accuracy of stored data. Following a specific process will help to reduce instances of missing information and will allow certain metrics to be compared across business units.
Examples and Steps of an IT Organization Process Flow Chart
Too many IT departments, from both small and large companies, have not adequately adopted process documentation to aid in the day-to-day running of IT operations. Ongoing analysis and management of IT operations can pay dividends for the company in numerous ways. Here are some areas within the IT function that can benefit from ongoing process improvement and flow chart use:
IT Procurement: Use flow charts, or workflows, to streamline vendor selection, contract negotiation, hardware replacement and vendor management within your IT operations.
IT Project Management: Project management benefits from flow chart use by showing the blueprint for what is needed to carry out a technology related initiative including budget analysis, deadline requirements, staffing estimates, etc.
Application Development & Support: Creating an efficient pathway for the testing and deployment of enterprise applications will help to increase application functionality in the early stages of its launch.
Network Administration: This function is responsible for managing the data centers, servers and overall IT infrastructure within the company. Document the activities that need to take place in order to keep up and maintain network hardware.
Systems Analysis: This group works with end users to understand the specific needs of their respective business units in terms of system capabilities. Use checklists and flowcharts to ensure clear communication between system architects and end users.
IT Security: IT security is essential to the protection of sensitive employee and customer data. Workflows can help the IT security function by acting as a model for how and when to update device security requirements.
Business Intelligence (BI): Flow charts can be extremely beneficial to the BI function by standardizing the contents and updating methods of management reports. This will help to improve data consistency, which will allow managers to get more granular insights into their operations.
User Support & Services: The user support group (also known as help desk) is in charge of issue resolution for employees as well as customers. Map out the optimal issue resolution process, beginning with the opening of a support ticket and ending with the resolution and closing of that same ticket.
Select an industry.
-
Support Group Operations
-- 344Finance
- 245Human Resources
- 230Information Technology
- 372Marketing
- 70Legal
- 93Compliance
- 165Shared Services
- 16Risk Management
-
General Line Groups
-- 150Call Center
- 150Customer Service
- 162Product Development
- 102Collections
- 300Sales
-
Supply Chain Operations
- -
Financial Services
-- 966Banking
- 229Insurance
- 130Mortgage Lending
- 428Investment Management
- 445Broker Dealer
- 235Consumer Finance
-
Healthcare
- -
Other Services
-- 118Utilities
- 65Print Publishing
- 68Broadcast Media
- 263Advertising
- 90Retail
Let us take your KPIs & business intelligence efforts to the top.