What are Investment Banking Process Flow Charts?
Investment banks, broker dealers and asset management firms perform similar processes – they execute trades on behalf of their clients, conduct detailed investment research, develop client relationships (typically with high net worth individuals and institutional clients) and manage billions in assets. Flow charts for investment banks are particularly useful for high volume middle and back office workflows, where opportunity exists for automation, error reduction, better compliance oversight and customer service improvements.
Let us take your KPIs & business intelligence efforts to the top.
Contact us now to discuss a BI engagement with OpsDog.
Contact OpsDogUsing Flow Charts to Improve Investment Bank Process Efficiency & Service
Investment shops can make effective use of flow charts for streamlining many of the administrative processes that occur within middle and back offices. Certain processes where compliance comes into play are also candidates for detailed analysis and standardization. Regardless of investment strategy or market, investment banks typically use flow charts as a first step in automating (at least in part) certain business processes, including:
Trade Execution: There are many compliance checks and asset allocations that occur before and after a trade is executed. Detailed flow charts and standard business rules can help improve compliance and trade accuracy.
New Client On-Boarding: New client data collection and due diligence typically includes manual data entry and internal/external notifications. Analyzing these processes can help identify opportunities to standardize forms and data collection methods to reduce errors and cycle times.
Account Management: Updating client information (contact information, history, etc.) can be highly manual and span many systems. Documenting data capture points and system use patterns can help automate and improve these tasks.
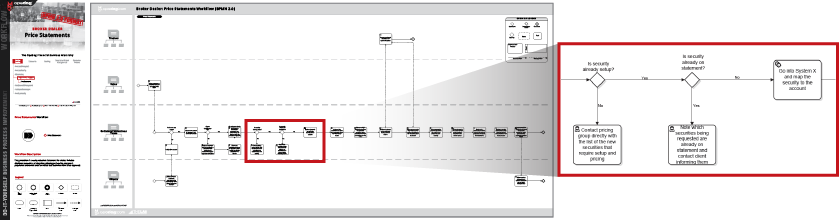
The Trade Process: Defining Steps in the Trade Lifecycle
The life cycle of a trade starts when a trade order is made – and ends when the trade has been settled and reported to the appropriate parties. Each step in the trade process requires accurate, timely data collection, entry and dissemination. Trade processing flow charts can help identify recurring issues and automate certain aspects of the trade process. The typical trade follows a repeatable pattern:
Capture: Trade data is sent to the execution desk for entry, where analysts ensure that all required information is accurate and prepped.
Match: The details of the trade are matched with both parties (typically 2 banks or clearing institutions). This is sometimes referred to as trade affirmation when a buy-side firm is involved.
Settle: The traded assets are electronically delivered to both parties. There are different settlement periods for different types of assets.
Reconcile: The amount or volume of the traded assets are confirmed to ensure accuracy.
Report: The details of the trade are reported to external regulators. The participants (sell-side or buy-side) and content of the report vary based on market and asset type.
If business intelligence is your pet project, empower it with custom dashboards from OpsDog.

Fortune 1000 customers are over the moon about OpsDog business intelligence!

Win the business-intelligence dogfight with custom KPIs and dashboards from OpsDog
Select an industry.
-
Support Group Operations
-- 344Finance
- 245Human Resources
- 230Information Technology
- 372Marketing
- 70Legal
- 93Compliance
- 165Shared Services
- 16Risk Management
-
General Line Groups
-- 150Call Center
- 150Customer Service
- 162Product Development
- 102Collections
- 300Sales
-
Supply Chain Operations
- -
Financial Services
-- 966Banking
- 229Insurance
- 130Mortgage Lending
- 428Investment Management
- 445Broker Dealer
- 235Consumer Finance
-
Healthcare
- -
Other Services
-- 118Utilities
- 65Print Publishing
- 68Broadcast Media
- 263Advertising
- 90Retail
Let us take your KPIs & business intelligence efforts to the top.