Key Risk Indicators Benchmarking Report for Technology Services
Benchmarking Report Bundle


Key Risk Indicators Benchmarking Report for Technology Services
Benchmarking Report Bundle
Which metrics, or KPIs, are included in this report?
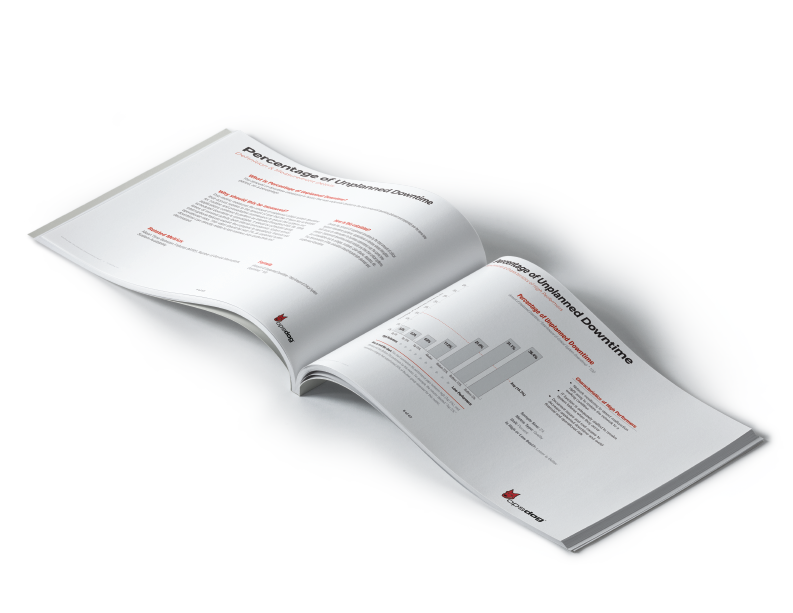
This 67-page benchmarking report includes benchmarking data for 30 Technology Services key risk indicator metrics, or KRIs, including Mean Time Between Failures (MTBF), Incident Closing Ratio, and more. Each KRI in this report includes a chart outlining high-to-low performer data, a detailed KRI definition, calculation instructions and a summary of high-performing company attributes. Stop operating in the dark – benchmarking is a major step in identifying potential improvements within any technology department. This report will give you a head start that you can’t find anywhere else.
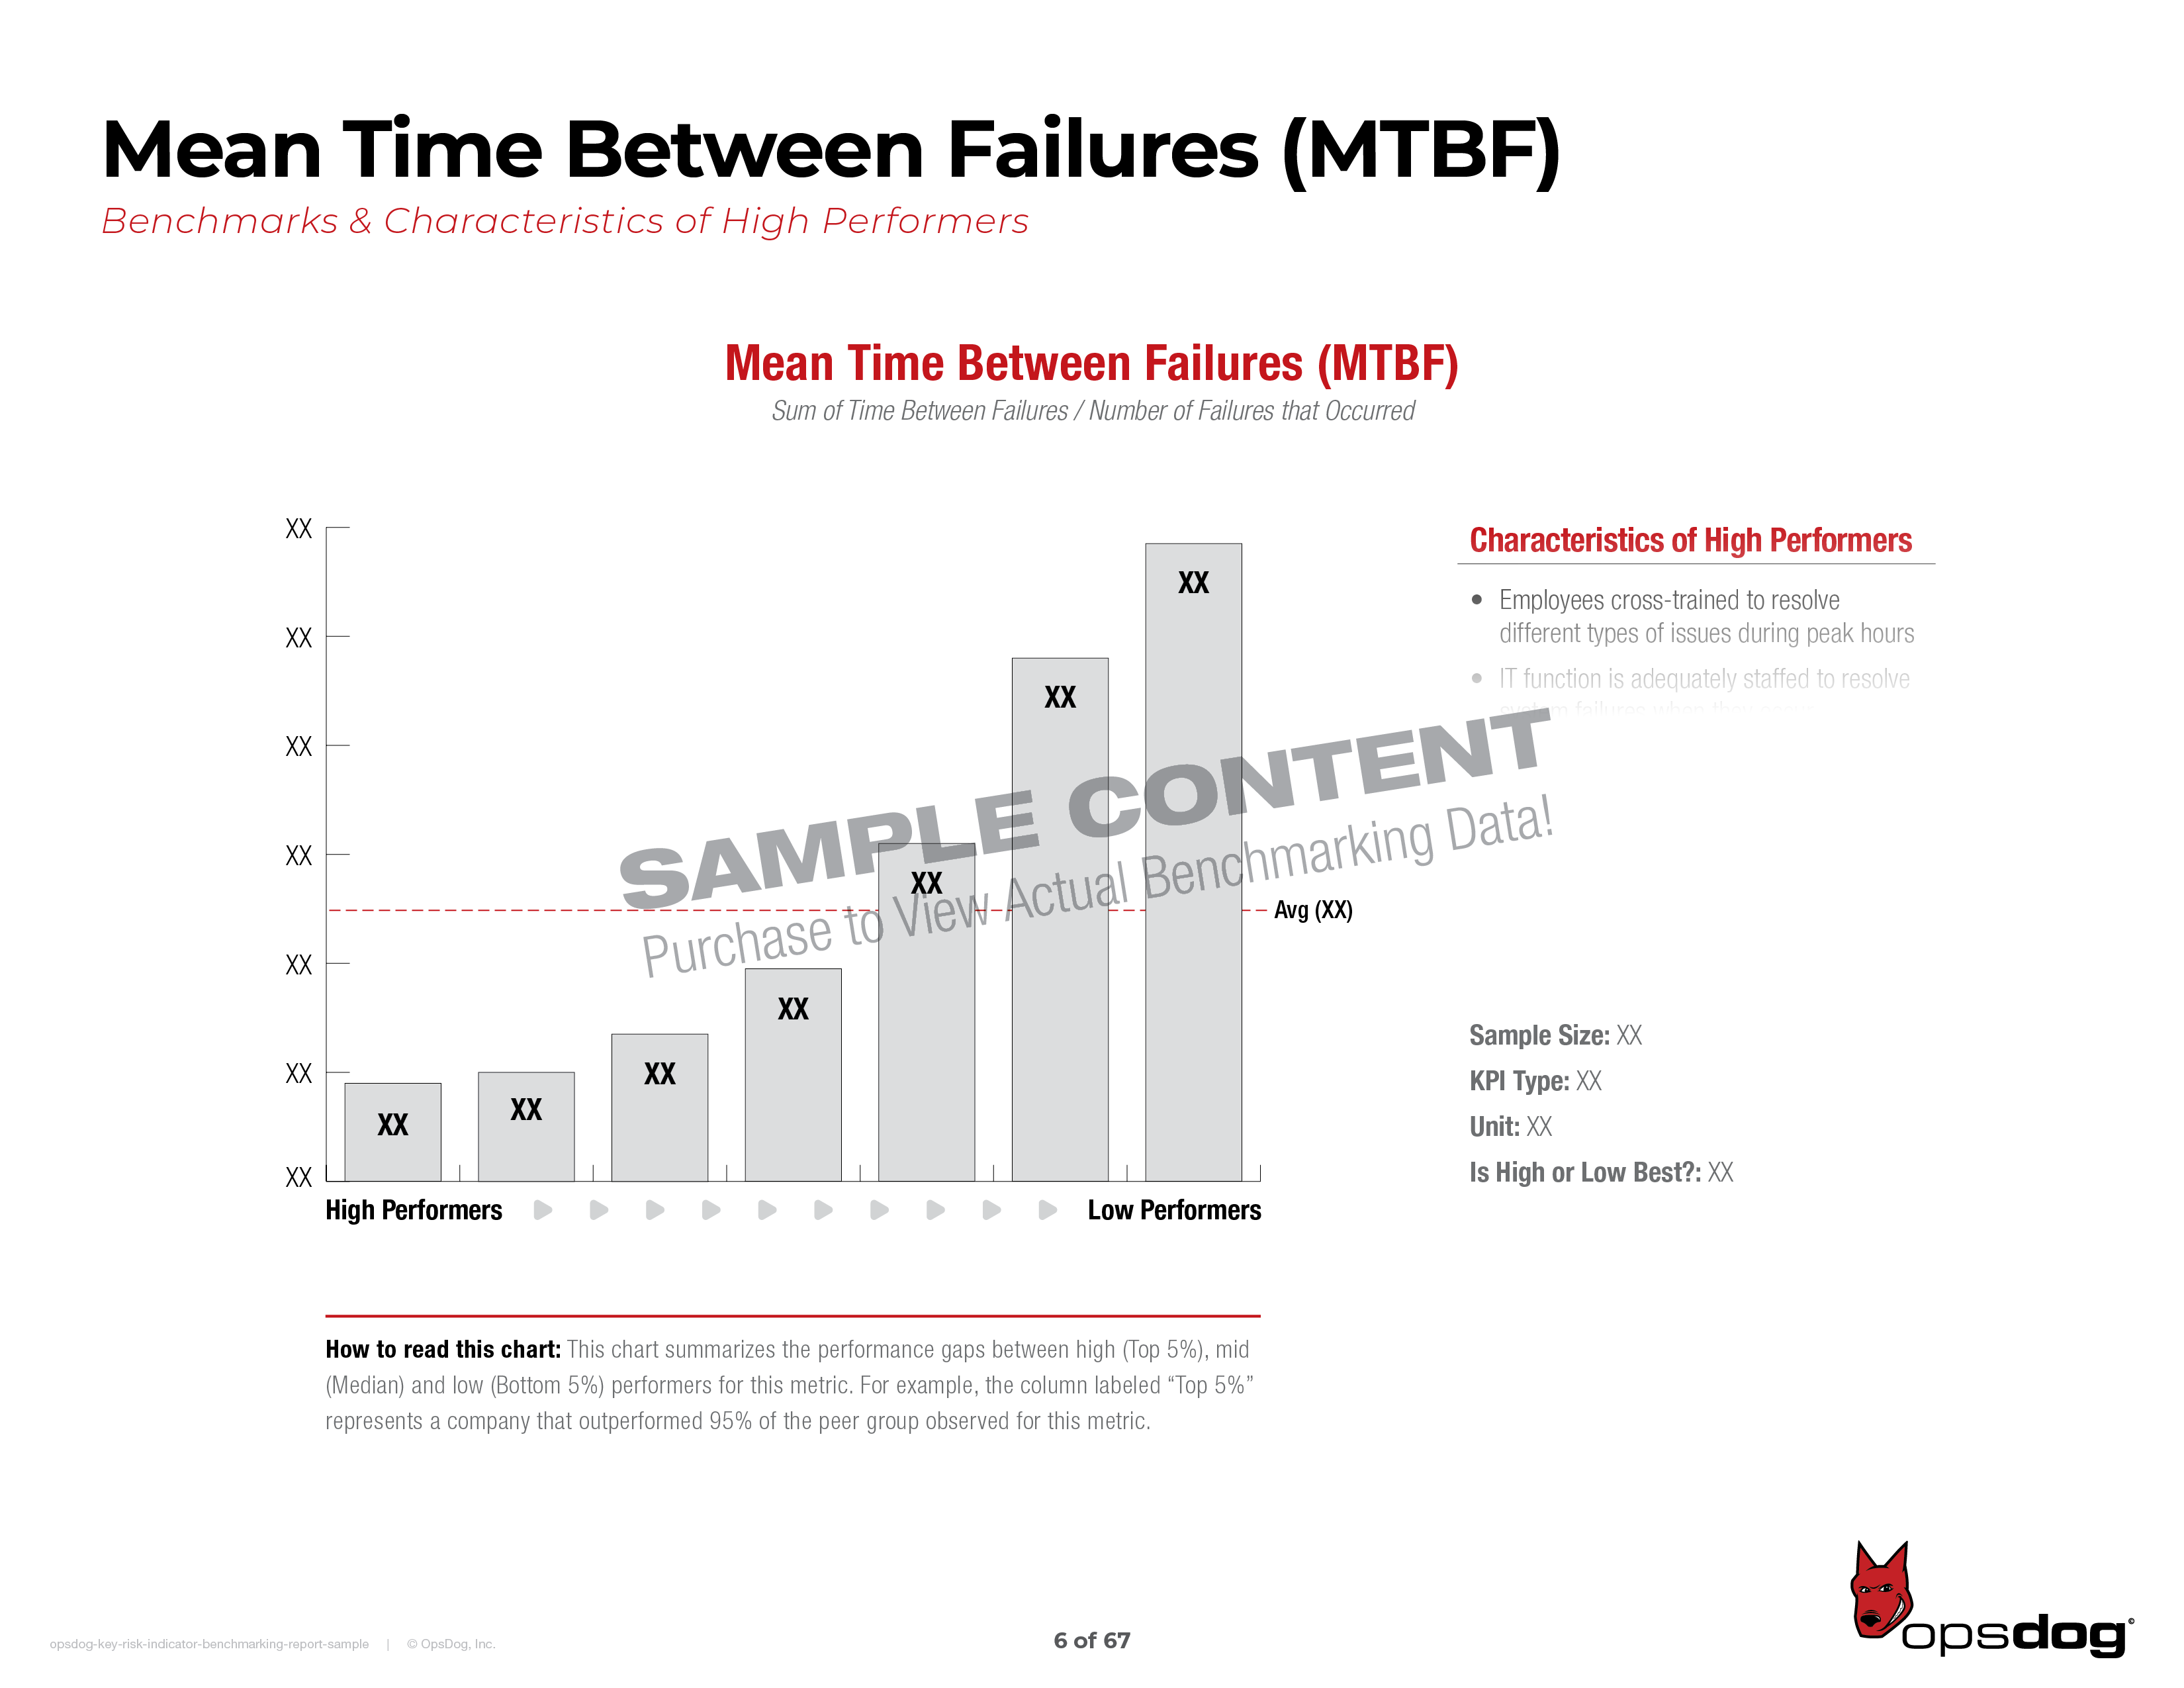
- Mean Time Between Failures (MTBF)
- Percentage of Unplanned
- System Availability (Severity I)
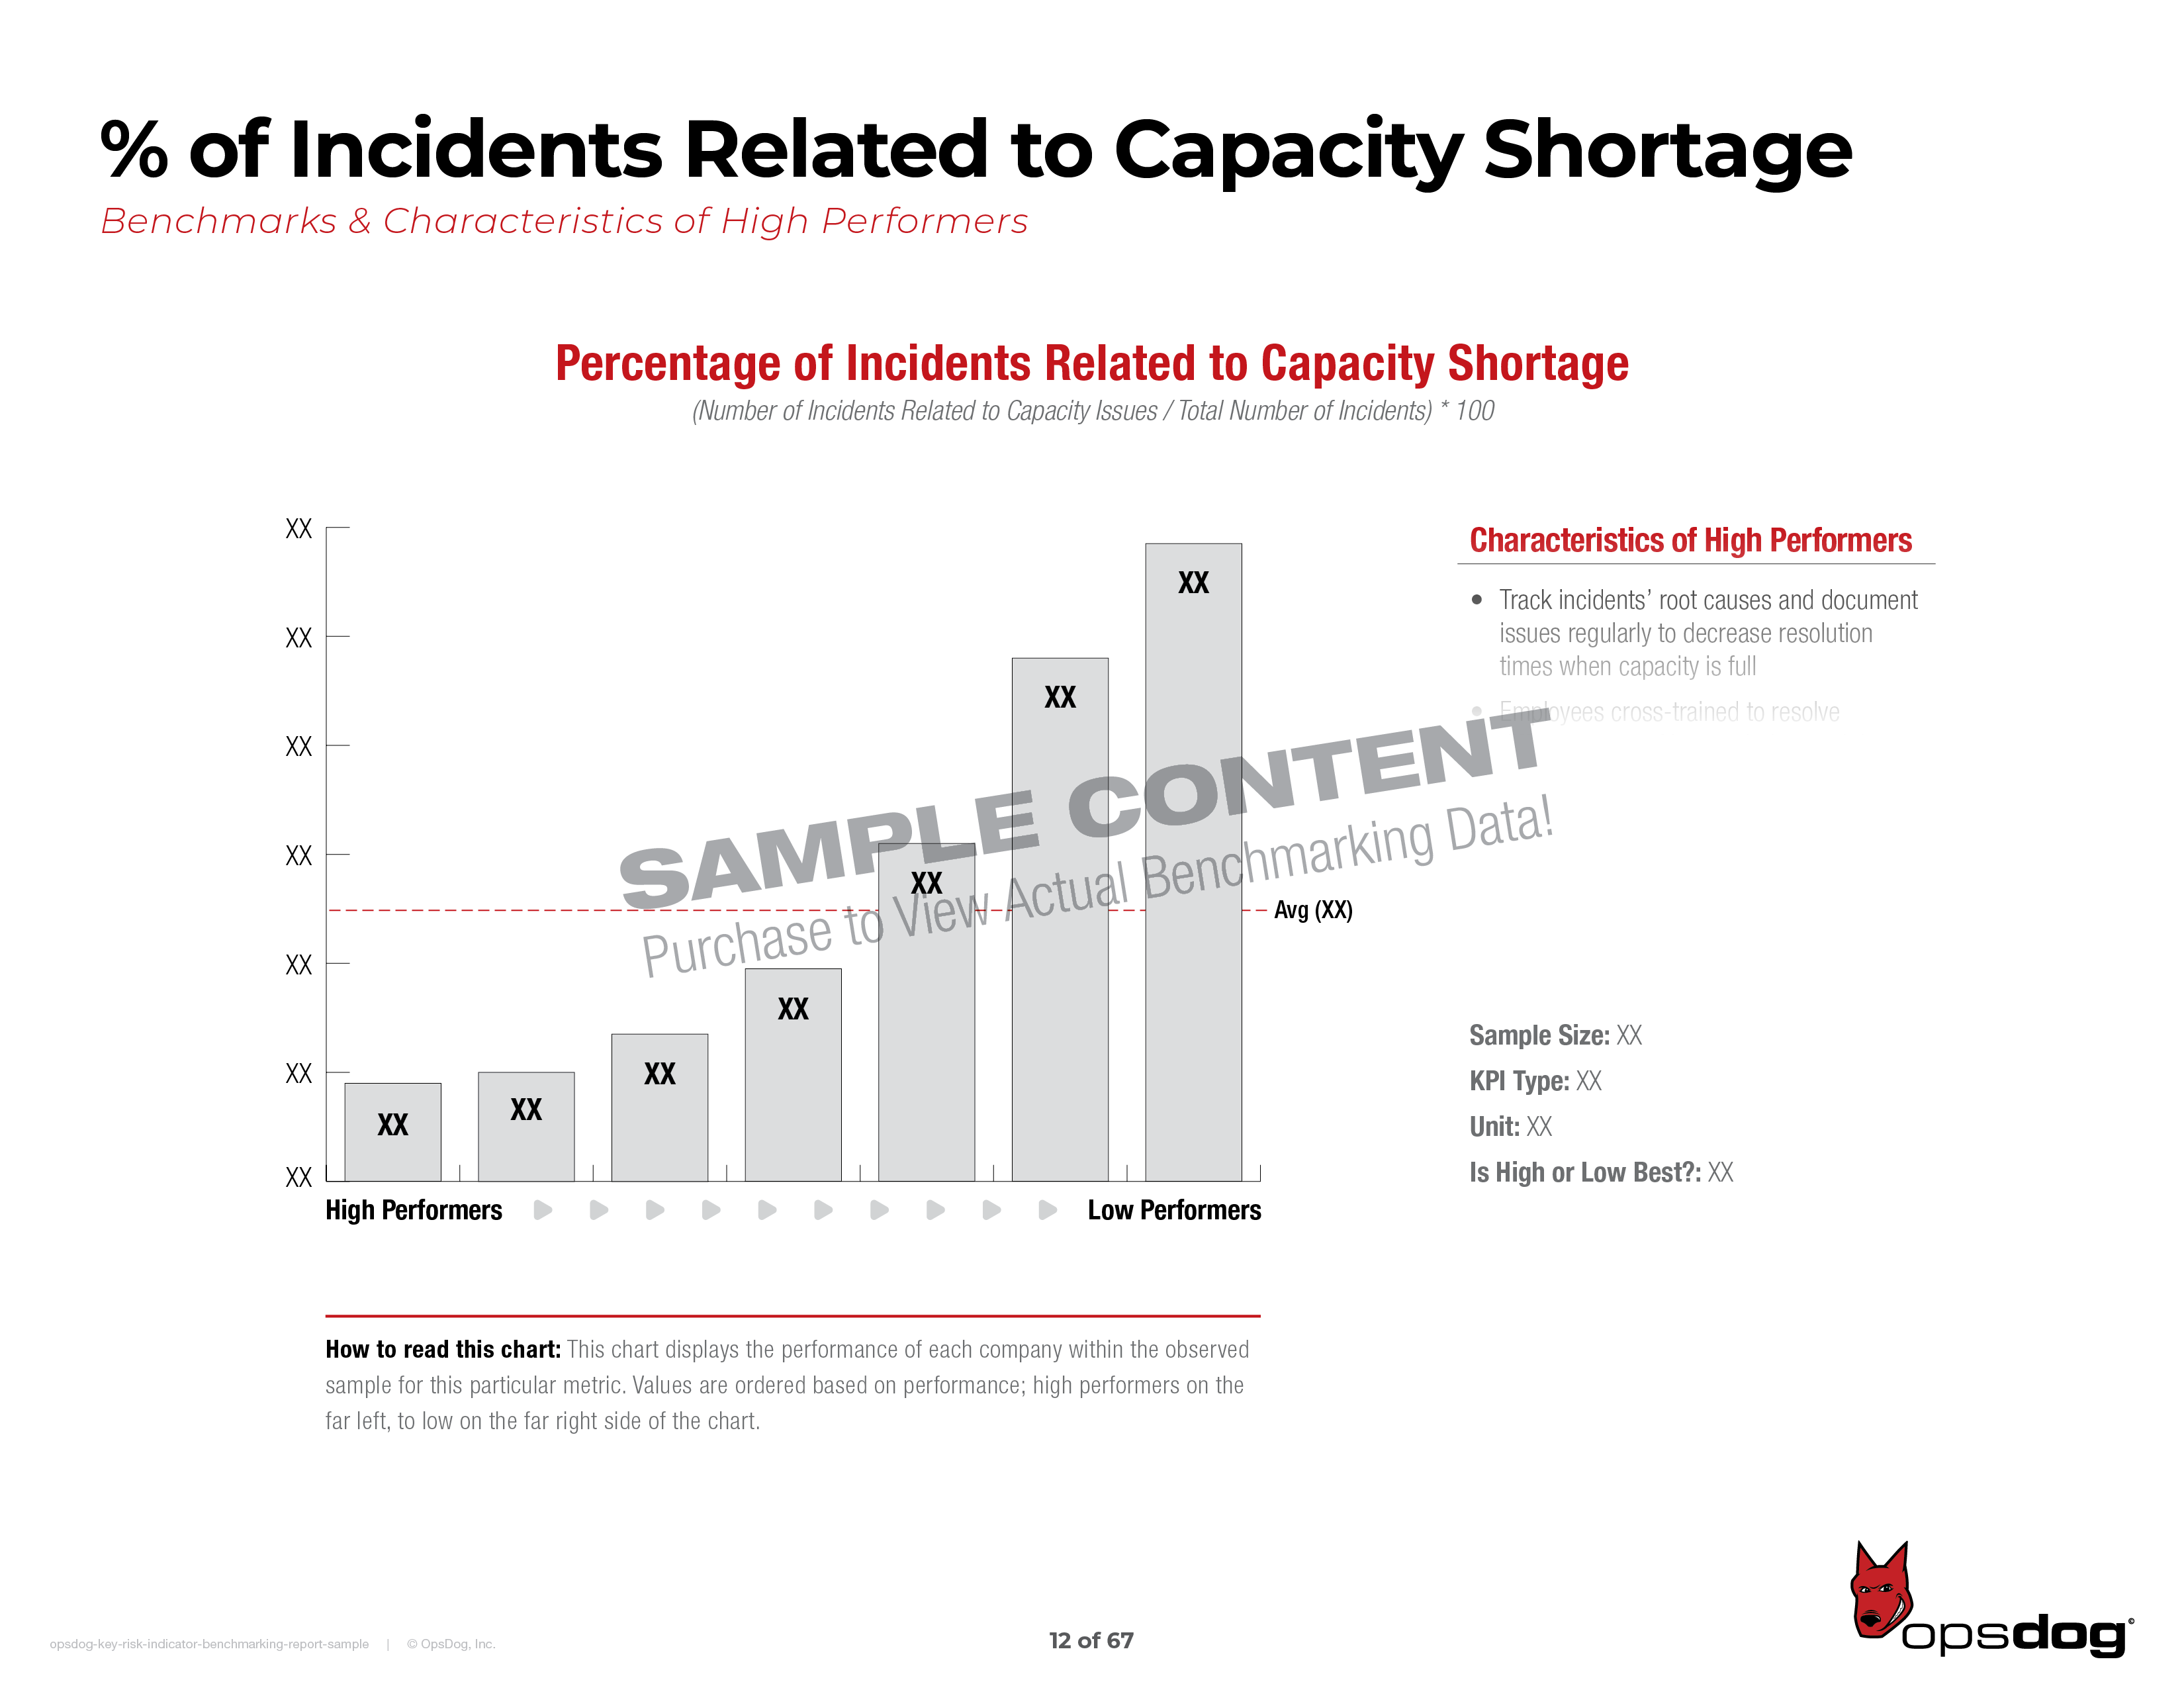
- Percentage of Incidents Related to Capacity Shortage
- Change Success
- Percentage of Emergency Changes
- Percentage of Incidents Caused by Recent Change
- Average Age of Known Problems
- Mean Time to Resolve (Problems)
- Problem Closing Ratio
- Percentage of External SLAs Met (Vendors)
- Percentage of Internal SLAs Met (Applications/Systems)
- First Time Fix-Rate (Incidents)
- Incident Closing Ratio
- Mean Time to Resolve (Incidents)
- Percentage of High Priority Incidents
- Percentage of Recurring Incidents
- Average Page Load Time (End-to-End)
- Average Page Size
- Elements per Page
- Abandonment Rate
- Average Speed of Answer
- Critical Overnight Process Success Rate
- Average Ticket Response Time
- Mean Time to Resolve (Ticket)
- Percentage of Tickets Escalated to Problem
- Network Availability (by System)
- Server Build Cycle Time
- Percentage of Assets No Longer Supported
- Percentage of Unmanaged Devices Detected on Network
Click to See More
Click to See less
Frequently Asked Questions
-
Q: How do you collect and validate your data? +
-
Q: How much information will my Benchmarking Report contain? +
-
Q: How often do you update your reports? +
-
Q: Your download-able reports look great. But I need something custom. Can you help? +
Related Products
Let us take your KPIs & business intelligence efforts to the top.
Contact us now to discuss a BI engagement with OpsDog.
Contact OpsDog
If you would like information on this product please enter your email below.