Banking Benchmarking Report
Benchmarking Report Bundle


Banking Benchmarking Report
Benchmarking Report Bundle
Which metrics, or KPIs, are included in this report?
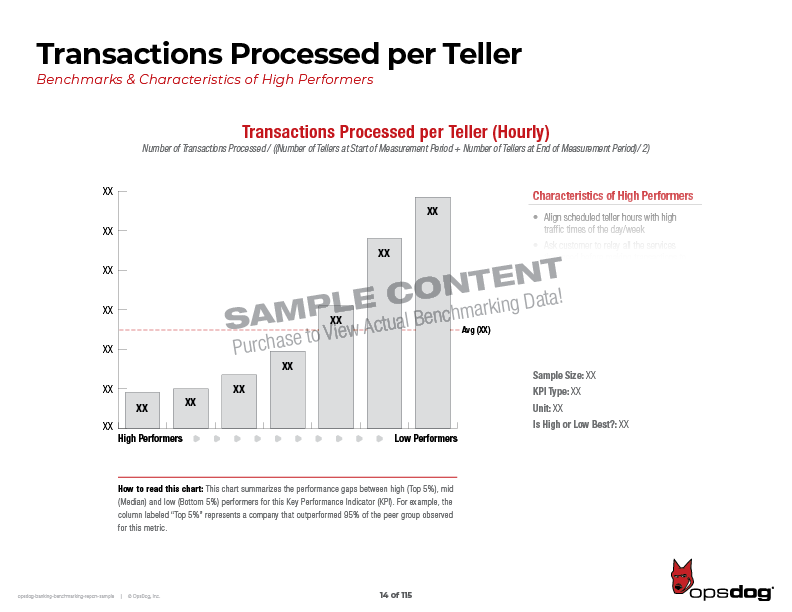
This 115-page benchmarking report includes benchmarking data for 50 Banking performance metrics, or KPIs, including Loan Processing Cycle Time, Cost per Loan Originated and more. Each KPI in this report includes a chart outlining high-to-low performer data, a detailed KPI definition, calculation instructions and a summary of high-performing company attributes. Stop operating in the dark - benchmarking is a major step in identifying potential improvements within any bank. This report will give you a head start that you can't find anywhere else.
- Assets Under Management (AUM) per Registered Financial Representative
- Average Retail Branch Lobby Wait Time
- Commercial Loan Application Processing Cycle Time
- Commercial Loan Application to Underwriting Decision Cycle Time
- Commercial Loan Charge-Off Rate
- Commercial Loan Officers per Commercial Credit Analyst
- Commercial Loan Origination Cycle Time
- Commercial Loan Recovery Rate
- Commercial Loan Underwriting Decision to Close Cycle Time
- Commercial Loans Closed per Processing Employee
- Commercial Loans Outstanding ($) per Loan Servicing Employee
- Commercial Loans Outstanding per Commercial Loan Officer
- Consumer Loan Applications per Processing Employee
- Consumer Loans Closed per Consumer Lending Employee
- Consumer Loans Serviced per Servicing Employee
- Cost per Commercial Loan Origination
- Cost per Equity Trade (Back Office)
- Cost per FX Trade (Back Office)
- Deposit Accounts per Transaction Processing & Support Employee
- Equities Trade Break Rate
- Investment Management Fee Revenue as a Percentage of Assets Under Management
- Lockbox Item Processing Hold Over Rate
- Mortgage Application Approval Rate
- Mortgage Applications per Processor
- Mortgage Applications per Underwriter
- Mortgage Closing Cycle Time
- Mortgage Loans Serviced per Mortgage Loan Servicing Employee
- Mortgage Production per Loan Officer
- Mortgage Pull-Through Rate
- Mortgages Closed per Closer
- Mortgages Closed per Loan Officer
- Mortgages Closed per Secondary Employee
- New Equity Accounts per Investment Account Onboarding Employee
- Origination Revenue per Mortgage
- Percentage of Commercial Loans 30-89 Days Past Due
- Percentage of Commercial Loans 90+ Days Past Due
- Percentage of Commercial Loans Extended (Maturity Date)
- Percentage of Commercial Loans Secured by Collateral
- Percentage of Commercial Loans Subject to Pre-Payment Penalty
- Percentage of Mortgage Loans Abandoned by Borrower
- Percentage of Non-Accrual Commercial Loans
- Production Labor Cost per Mortgage Originated
- Registered Financial Representatives per Trade Operations & Support Employee
- Retail Branch Span of Control
- Revenue per Lockbox Account
- Revenue per Registered Financial Representative
- Teller Transaction Cycle Time
- Transactions Processed per Teller
- Unit Cost: Mortgage Loan Origination
- Unit Cost: Mortgage Loan Servicing
Click to See More
Click to See less
Frequently Asked Questions
-
Q: How do you collect and validate your data? +
-
Q: How much information will my Benchmarking Report contain? +
-
Q: How often do you update your reports? +
-
Q: Your download-able reports look great. But I need something custom. Can you help? +
Related Products
Let us take your KPIs & business intelligence efforts to the top.
Contact us now to discuss a BI engagement with OpsDog.
Contact OpsDog
If you would like information on this product please enter your email below.