Investment Management Benchmarking Report
Benchmarking Report Bundle


Investment Management Benchmarking Report
Benchmarking Report Bundle
Which metrics, or KPIs, are included in this report?
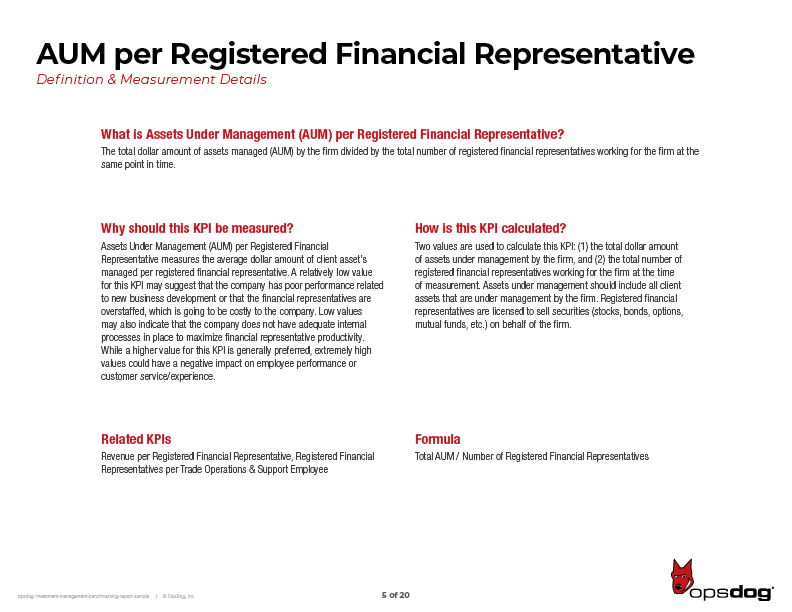
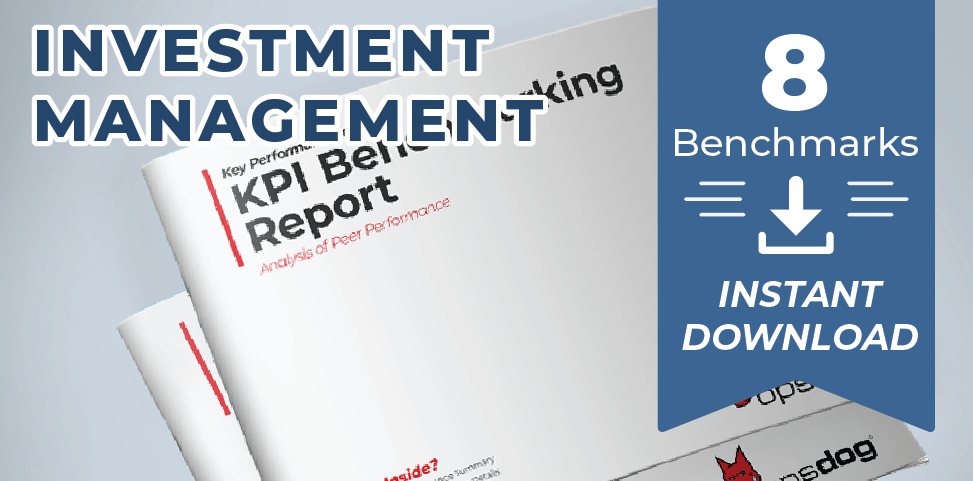
This 20-page benchmarking report includes benchmarking data for 8 investment and wealth management operations KPIs including Assets Under Management (AUM) per Registered Financial Representative, Cost per Equity Trade (Back Office) and more. Each KPI in this report includes a chart outlining high-to-low performer data, a detailed KPI definition, calculation instructions and a summary of high-performing company attributes. Stop operating in the dark - benchmarking is a major step in identifying potential improvements within investment management operations. This report will give you a head start that you can't find anywhere else.
- Assets Under Management (AUM) per Registered Financial Representative
- Cost per Equity Trade (Back Office)
- Cost per FX Trade (Back Office)
- Equities Trade Break Rate
- Investment Management Fee Revenue as a Percentage of Assets Under Management
- New Equity Accounts per Investment Account Onboarding Employee
- Registered Financial Representatives per Trade Operations & Support Employee
- Revenue per Registered Financial Representative
Frequently Asked Questions
-
Q: How do you collect and validate your data? +
-
Q: How much information will my Benchmarking Report contain? +
-
Q: How often do you update your reports? +
-
Q: Your download-able reports look great. But I need something custom. Can you help? +
Related Products
Let us take your KPIs & business intelligence efforts to the top.
Contact us now to discuss a BI engagement with OpsDog.
Contact OpsDog
If you would like information on this product please enter your email below.