Insurance policies – the older you get, the more of them you find yourself paying a monthly bill for. While individuals have multiple policies to worry about – house, auto, life, etc. which can get overwhelming – businesses have even more to consider when they are searching for insurance coverage to minimize business risk. Professional liability, workers’ compensation, cyber liability, crime coverage – if you can dream of some type of risk, there is an insurance policy that covers it, and someone looking to buy that coverage.
Today, many insurance companies focus only on business Key Performance Indicators (KPIs) related to total dollar amounts of transactions processed (income) and the high-level expenses (overhead) that it took to process the work without diving into operations focused KPIs at the forefront of the business. Many insurance productivity KPIs tracked at the front-line employee level are often overlooked by different departments at large insurers. Just because an indicator doesn’t appear to be directly linked to income, doesn’t mean it won’t affect the company’s revenue in some way, so don’t fall down the hole of ignoring operations focused KPIs during your business intelligence implementation or benchmarking project.
What are Key Performance Indicators for Insurance Companies?
Insurance Key Performance Indicators are defined as the quantitative values used to determine how efficiently and effectively specific insurance operational goals and objectives are achieved by the insurance company over a certain period of time. Front-line employee level insurance KPIs focus on individual employee productivity, employee work quality, the cost of employee work activities, as well as employee staffing levels.
Benefits of measuring and benchmarking key performance indicators at the front-line employee level in your company’s business intelligence implementation efforts include:
- Increased productivity and performance management of front-line insurance staff
- Reduced amounts of customer turnover and increased revenue
- Reduced claims processing expenses achieved by driving down the potential for human errors
- Balanced Claims Department staffing levels and cost
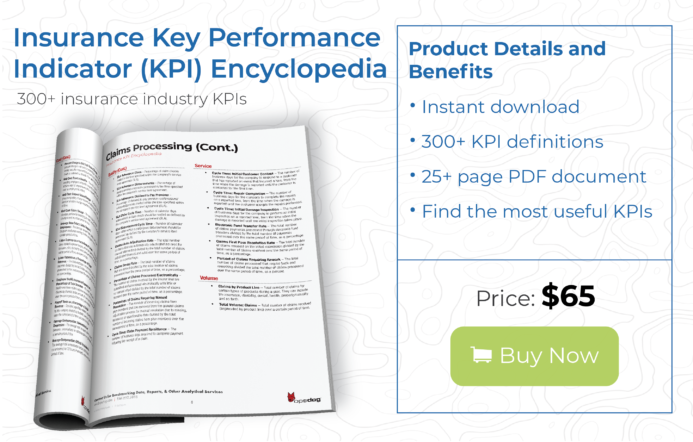
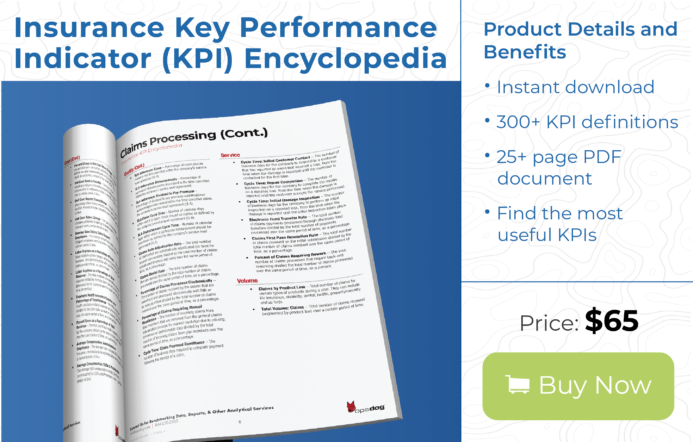
Purchase the Opsdog Insurance KPI handbook to help select the measurements you need today.
Let’s take a moment to look at 6 front-line employee level insurance industry KPIs operations managers should not overlook when performing benchmarking analysis or analyzing business intelligence.
Key Performance Indicators for Insurance Companies # 1: New Policies per Agent
At the front office of the business where agency operations and revenue producers reside, an insurance at the individual agent level is New Policies per Agent. This insurance industry KPI tracks individual level productivity and allows your insurance company to benchmark producers against one another internally or against external competitors.
Everyone wants to have the most effective sales team, right? This insurance KPI should be tracked at a daily level to roll up into weekly and monthly summaries to set goals focused on increasing revenue. To further utilize this insurance industry KPI, ensure that these summaries aren’t just filed away, but are used for targeted employee training to bolster the effectiveness of your company’s sales force.
Key Performance Indicators for Insurance Companies # 2: Insurance Underwriting Cycle Time
This insurance KPI measures the number of business days it takes an underwriter to process a property & casualty (P&C) insurance policy application, from the time the insurance application is submitted to the underwriter until the formal decision has been made. Be on the lookout for unproductive underwriters and inefficient customer information collection practices as these issues may increase the total amount of time it takes to underwrite an insurance policy.
Insurance Underwriting Cycle Time can also be used when gauging customer satisfaction, because, the longer it takes your company to provide a policy ready for signing, the unhappier the customer will be. Not only do unhappy customers typically seek out policies with other insurance companies, but companies who provide faster underwriting cycle times may even be able to grab customers right out from under your nose.
Key Performance Indicators for Insurance Companies # 3: Cost per Application
After a new policy has been captured by a producer (agent) in the front office, it is sent to the back office’s New Business Processing Group for underwriting and onboarding. But capturing and processing insurance policies does not come cheap.
The Cost per Application insurance KPI measures the amount of expense incurred during the processing of a single new property & casualty (P&C) insurance application. A high value for this insurance industry KPI can indicate a number of issues that need to be addressed, such as employees that are not as productive as peers that are benchmarked, high amounts of manual and unstandardized data entry, improper quote generations, etc. Look to improve employee training and simplify the insurance application itself to cut down the potential for human error and reduce cost per application related key performance indicators.
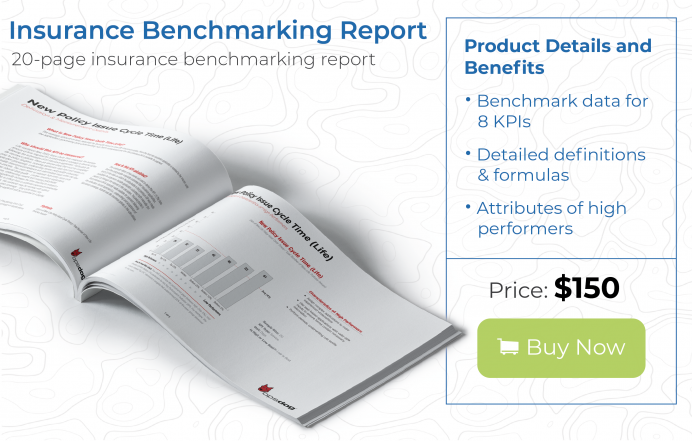
Looking for insurance benchmark data? Buy it here now…
Key Performance Indicators for Insurance Companies # 4: Claims Employees per 1,000 Reported Claims
Does this sound familiar? Phone lines are full, stressed staff are losing patience with their customers and claims are piling up so high, desks are starting to crack. If you’ve experienced this, you’re probably asking yourself how this mess can be fixed. The first step you should take is to measure Claims Employees per 1,000 Reported Claims. This insurance KPI measures the staffing levels within the claims group relative to the incoming workload, or claims volume, to point to potential issues in employee productivity related to work volume.
A high value for this KPI doesn’t necessarily mean that you need to lay off people tomorrow, but you should start digging into deeper productivity business intelligence analysis. A high value for this insurance industry KPI could indicate poor individual productivity or a non-standard claims processing workflow. Look to streamline or standardize the claims service process to help the staff handle the claims quickly and efficiently. Be sure to assess customer service levels in conjunction with this insurance KPI. An unmanageable workload is bad; no workload is worse.
Key Performance Indicators for Insurance Companies # 5: Cost per Claim
Riding on the tail of metric number 4 above, this expense-focused insurance KPI measures how much money an insurance company spends processing each individual claim. Obviously, insurance companies should want the value for this insurance industry KPI to be as low as possible. The lower the value, the more efficient the workforce, and the more money the insurance company saves.
To calculate Cost per Claim, take the total cost associated with processing property & casualty claims and divide it by the number of claims received for a given time period. This is helpful when deciding premium prices or evaluating options for reinsurance since this insurance industry KPI helps companies properly asses the risk associated with each type of policy.
Key Performance Indicators for Insurance Companies # 6: Policies In-Force per Insurance Agent
By using this productivity insurance KPI, you can measure the number of insurance policies in-force, or active, relative to the number of insurance agents working for the company. The Policies In-Force per Insurance Agent insurance industry KPI can be used to identify inefficiencies in retaining insurance policyholders.

Look to increase customer-facing interactions and personal marketing of services, increase training for agents who need it, and simplify the insurance renewal process in, and of, itself, to increase the value of this insurance KPI. While customer-facing interactions can range from giving personalized sales pitches, to answering customer inquiries, if insurance agents aren’t able to provide customers with the policies they need with as little hassle as possible, customer satisfaction will decrease and those same customers could end up finding insurance policies with other companies. Obtaining an insurance policy can be very confusing, so be sure that insurance agents are as clear and concise in their customer-facing interactions as possible.
Key Performance Indicators for Insurance Companies – Our Benchmarking and Business Intelligence Resources
Thanks for the read, if any of these key performance indicators caught your attention, lets talk. Not measuring and benchmarking operational insurance KPIs can lead to high rates of customer dissatisfaction, low employee productivity rates and even increased staffing costs.
Download The Opsdog Life Insurance Administration KPI Benchmarking Report Today!
If you would like additional information on our “offsite” benchmarking or business intelligence implementation services, be sure to reach out to us here.