What is healthcare analytics?
Healthcare analytics is defined as quantitative and qualitative processes that are used to enhance healthcare productivity through desktop, server or cloud-based applications that store and categorize data to draw conclusions through the patterns that emerge.
The data analyzed can be historical, old records already in the company, or new information that is being processed from internal or external sources. Using data analysis within the healthcare industry can increase revenue, improve efficiency within the business, optimize customer service, and plan ahead to outpace competitors in the marketplace.
There are many types of data analytics, from simple to complex, used to build reports and dashboards:
- Exploratory Data Analysis (EDA) – This methodology is used to locate patterns and relationships in data
- Confirmatory Data Analysis (CDA) – A methodology that uses statistical techniques to find if theories about the data are correct
- Data Mining – Requires sifting through large sets of data to find trends or patterns
- Predictive Analytics – This uses data to try and predict behavior from customers, equipment, or other events
- Machine Learning – This uses AI (Artificial Intelligence) to go through data in place of a human, using pre-programmed algorithms
- Business Intelligence (BI) – A set of processes and technologies that take raw data and change it into useful information to enable better decision-making
Data Analytics in healthcare is the use of the above techniques in the healthcare field. It’s the analysis and display of hospital or medical service data warehoused in multiple company systems. Primary activities that must be undertaken during a data analysis project include identifying the right hospital KPIs to measure, cleaning, scrubbing and meta-tagging healthcare data to line up with the KPIs to measure, and then displaying it visually using software like Tableau, Microsoft Power BI, Domo, or Qlik.
Examples of data analytics in healthcare
A real-life example of data analytics positively impacting a healthcare business is the case of the Washington State Heath Care Authority. Like many healthcare organizations, they faced overuse and overcrowding of their ER departments leading to thinning staff and rising care costs.
With the use of an individually-tailored data analytics project, including targeted business intelligence, the organization wrangled patient data to identify frequent patients and share their data across multiple hospitals.
This wrangled and enriched data was then used to improve patient care both in the emergency room and out of it. Hospitals could tap into one organized and enriched well of data in the form of a data analysis project that let them track and review patient data, including prescription information and frequency of ER visits.
By formulating a clearer picture of their patients, hospitals could tailor their care specifically and reduce the number of visits. The result as of fiscal year 2013 was over $33 million in savings for emergency care costs.
Wrangling big data to implement healthcare analytics
A data analytics project is dependent on good data. Data that is raw, messy, and without any standardization won’t be beneficial to a project. If you look at a simple form of data found in almost all healthcare facilities, the electronic medical record (EMR), this is the digital version of a paper medical record and it might be a wealth of information, but it’s currently not standardized.
Each facility might have their own way of organizing the information on EMRs and patients themselves have their own records with information from modern wearables such as Fitbits. Data like this doesn’t help because it doesn’t translate into any of the benefits of dashboards in healthcare.
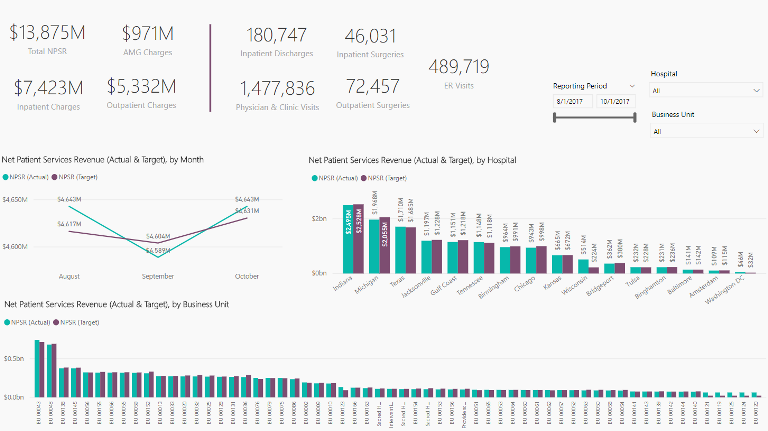
Although, with a bit of tweaking and implementing data analysis techniques, data pulled from EMRs will eventually look like this:
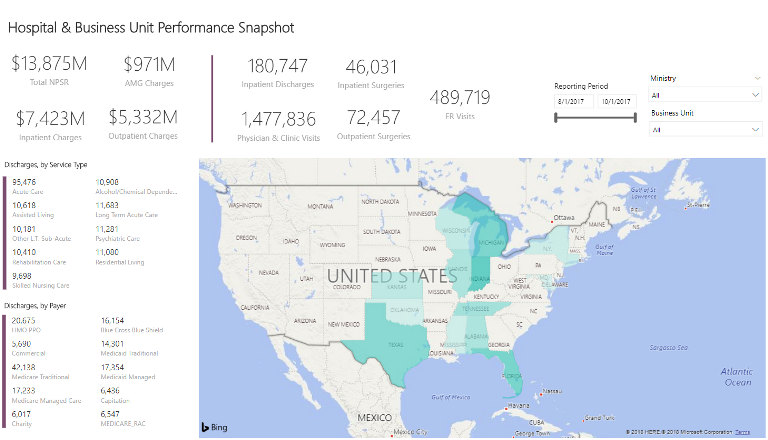
Above you can see a healthcare analytics snapshot using Microsoft Power BI displaying the performance of all locations of a hospital network.
You can still see the benefits of dashboards in healthcare from the image above. Specifically, that dashboard can be used to visualize the performance of hospitals around the country, focusing on discharges per region and discharges per payer. A dashboard like this one acts as a perfect start to a larger healthcare analytics dashboard. It shows an easily-digestible amount of data and gives executives an idea of how to drill down further.
Healthcare analtics alone can answer a few important questions. Which region has the highest/lowest concentration of discharges? What payers are contributing most to hospitals overall? How many ER visits happen throughout my healthcare organization in total?
These questions are a good start, but there are deeper benefits to healthcare analytics, which we will discuss below.
Benefits of healthcare analytics and operational data visualizations in hospital networks
Effective healthcare analytics come with the kind of operational intelligence that allows you to drill down and through data and get to the source of what your healthcare analytics project is telling you broadly.
Unlike a static, Excel-only report, a healthcare analytics dashboard can show real-time, fresh, and relevant data. Investing in analyitcs is therefore extremely important if you’re looking for benefits such as the following:
- Transforming underutilized and unstructured hospital data into analytics assets that drive financial decision making and results. By wrangling the right kind of healthcare data, you can see facts about your business that you might never have known otherwise. For example, take something as simple as discharges and break it down into specific categories. Specifically, you can use the data provided by your healthcare dashboard to potentially reduce the number of re-admissions your hospital sees. A study from the Agency for Healthcare Research and Quality (AHRQ) noted that costs associated with patients readmitted within 30 days reached $41.3 billion. You can mitigate that cost by using the data analytics inherent in healthcare BI to track patient data and pinpoint the most high-risk patients and screen for the most likely conditions responsible for re-admissions such as behavioral or mental health issues.
- Operational healthcare analytics in real-time instead of waiting for monthly manual Excel report. Creating analytics that can update in real-time instead of creating analysis for monthly reports manually. You can input new data into your healthcare analytics dashboards and let the software do the work for you. This is faster, cheaper, and more accurate.
- Increased accuracy of hospital operations reporting. Constant manual reporting leaves room for plenty of mistakes, called “human error”. Faulty data can lead to increased costs and expansive rework to fix mistakes. Instead, a locked in healthcare analytics dashboard removes the possibility of human error, saving both time and money.
Seven Case Study Examples of Healthcare Companies Implementing Analytics
Sisense – Union General Hospital
Founded in 2010, New York-based Sisense offers business intelligence solutions to help companies more efficiently prepare, visualize and draw meaningful insights from their data. In a case study, Sisense describes how it helped Union General Hospital, a nonprofit healthcare provided based in Northern Georgia, reducing data analysis time from a day to five minutes.
Sisense reports that Karen Reff, the hospital’s Manager of Decision Making Support, handles roughly 20TB of data found within Excel files and relational database management systems (DBMS). Examples of data include digital patient charts, electronic medical records (EMRs),
and hospital information used to run day-to-day operations.
The hospital’s EMR system did not function optimally, the hospital’s CFO spent the majority of his time manually crunching data in Excel and IT resources were limited. The hospital required an efficient business intelligence solution that was easy for staff to operate.
“In nonprofit healthcare you can’t get discouraged if you don’t have a million-dollar budget and a staff of 30 to support healthcare analytics. Sisense is allowing us to make progress within our means.” -Karen Reff, Manager of Decision Making Support, Union General Hospital
Prior to implementing the Sisense BI system, the hospital’s 30-day readmission data could only be reviewed and reported on a quarterly basis due to an extensive administrative process. Now, the case management team can access and the information on a monthly basis. With real-time analysis capability, case managers can identify opportunities to reduce readmissions when the first arise.
Domo – Apria Healthcare
Founded in 2011 and based in Utah, Domo offers a BI platform to help organizations manage their operations. In a case study, Domo describes its work with Apria Healthcare, a home healthcare organization with over 400 locations nationwide and serving over 1.2 million patients each year. Apria specializes in respiratory services and related medical devices such as oxygen and sleep apnea treatments.
Prior to Domo, Apria experienced challenges in tracking real-time data on sales performance. This was due in part to siloed data storage and retrieval processes which didn’t allow for a comprehensive and integrated assessment of sales.
“Our biggest challenge before Domo was disparate data, and we struggled with sales visibility. We would get sales data a month and a half after the sale had occurred, and we didn’t get it across the dimensions that we needed to get a real view of our business.” – Jim Slagle
Sr. Director, Business Intelligence & Data Analytics, Apria Healthcare
According to the case study, after implementing Domo, Apria was able to gain a centralized perspective of its sale metrics. As depicted in the dashboard example below, examples of real-time data tracked by Domo include cash balances, social media performance data and website traffic.
Image: https://web-assets.domo.com/blog/wp-content/uploads/2015/12/actionable-data.jpg
Apria claims that Domo’s data analysis allowed the company to enhance its decision-making capabilities such as providing insights into where it derived most of its business and opportunities for increasing market visibility.
Qlik – Children’s Healthcare of Atlanta
Founded in 1993 with headquarters in Philadelphia, PA, Qlik Technologies offers a BI and analytics platform to help companies achieve actionable insights from their data.
In a case study, Qlik describes how it helped Children’s Healthcare of Atlanta (CHOA) improve its functionality in critical areas including operations, finance and R&D. Described as one of the largest providers of clinical care for children in the U.S., Children’s Healthcare of Atlanta is spread across 3 hospitals, 16 neighborhood locations, and manages the care of more than 500,000 patient visits each year.
It is important to keep in mind that while there are common needs in terms of data analytics, each healthcare organization does have certain needs that are unique to its patient population and performance goals. CHOA had tried other BI platforms in the past but they did not work well for the organization and began to cause tension between CHOA’s IT and Business departments. Ultimately, the Qlik platform was found to be better suited for CHOA’s specific goals.
Results achieved upon implementing the Qlik platform included an over 65 percent reduction in reporting time, elimination of a 10-12 day waiting period for research-related inquiries and insights gained on how to reduce costs and increase quality assurance.
Dundas – Family HealthCare Network
Founded in 1992 and headquartered in Toronto, Canada, Dundas is BI company offering data analytics solutions. In a case study, Dundas reports how it helped a nonprofit community-based health organization ensure that federal goals were met.
Family HealthCare Network (FHCN) operates across 16 federally qualified health centers and provides primary healthcare services for more than 600,000 patient visits per year. FHCN sought out a BI solution to improving data visualization and data transparency across departments. A major goal of the healthcare organization was to improve its performance in the U.S. Department of Health and Human Services’ Uniform Data System (UDS) reporting. Data collected is this system are reviewed annually to ensure that health centers maintain compliance with legislative and regulatory requirements.
Active referrals are a vital component of FHCN’s business operations however they began to outpace the amount of consults that were received, potentially leading to other challenges. After implementing Dundas’ BI platform, active referrals decreased by 20 percent and time needed for report development was reduced.
Measuring hospital analytics in real-time
A healthcare analytics dashboard is simply an analytical tool that displays any type operational data. It’s an easily way to display data from multiple data sets. But you must standardize the data in a way that makes sense first. Not only do individual hospitals have access to electronic health records, the federal government has made it easier to access clinical trial and insurance data as well.
As we’ve mentioned, every hospital has its own set of EMRs for each of its patients. These records encompass the entire set of information a patient has within a hospital. Conveniently, if you’re an executive working with multiple hospitals under one company, then those EMRs are more than likely uniform. This makes it easier to compile data, as you’re starting from a common format. The state/federal information might be harder, as it might not be as uniform as it’s pulled from a variety of locations.
Across the country, state governments and the federal government maintain several different databases of medical information. One is the National Program of Cancer Registries (NPCR) from the Centers for Disease Control (CDC). This is a registry that brings together data from local registries nationwide that includes patient history, diagnosis, treatment, and status.
These kinds of databases are important because they give your healthcare data analytics access to a larger set of data. Depending on your reporting goals, you could cross reference government data with your own to create a clearer picture of your patients. More importantly, there are more opportunities for finding the right kind of data you need to better your healthcare data analytics project.
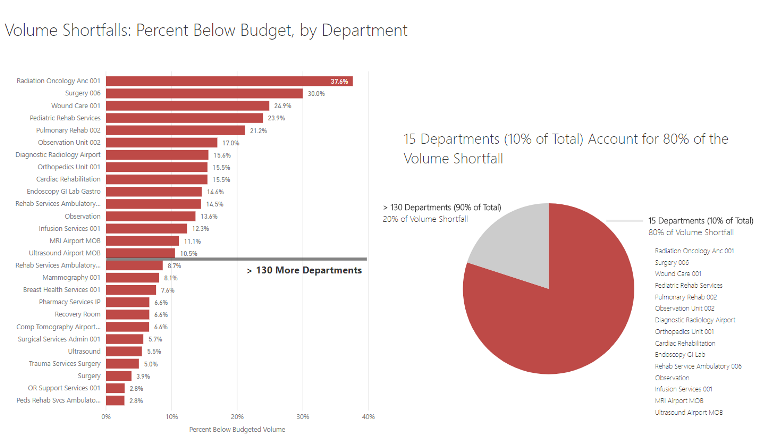
Because of the variety of healthcare public and private data available, analytics can visually track KPIs (key performance indicators) and other business intelligence factors across a wide range of healthcare processes. Healthcare analytics can show things such as patient trends, budget performance for specific departments, rate of certain tests, and more. You can use this data to see how long, historically, patients have stayed at a hospital. Utilizing this historical data could expose potential operational improvements in the admission-to-discharge pipeline.
The interplay between data analytics and your hospital’s admission-to-discharge pipeline is potentially beneficial to you, your hospital, your staff, and patients themselves. By selecting the right KPIs for your analytics, you can drill down into the specifics of what goes into a patient’s stay in your hospital. You can identify potential problem areas that could affect the discharge process, such as quality of care and number of staff available, and use this information to correct any dips in the process. Resulting in happier, and healthier, patients, and cost savings due to faster discharging times.
The benefits of analytics in healthcare are in many ways tied to the effectiveness of data analtyics dashboards. If bad data goes into your analytics, you get bad dashboards. That’s why it’s important to start with the end goal of the analytics in mind before you attempt to make any. Determine the business issue you want to measure and address before you go through the data.
How to create a healthcare analytics dashboard
Analytics dashboards depend on two things: proper front-end KPI selection and data preparation. Selecting the right KPIs determines the outcome of your healthcare analytics initiative.
Healthcare Key Performance Indicators. You can find our in-depth series on KPIs, what they are and how they can be used here. A simple detention of healthcare KPIs is as follows, they are numbers or ratios that measure how effectively a hospital department, group, process or individual is meeting defined goals and objectives. For example, important KPIs for a hospital or healthcare business are the Average Patient Length of Stay or Average Emergency Room Wait Time.
The second step is sourcing hospital operations data you think you need internally. All the data sets you want to use must be manually analyzed to see if they’re even useful for the KPIs you want to measure.
Real healthcare analytics examples from real clients
Not every healthcare analytics dashboard will be focused on KPIs that deal with patients. Sometimes operational issues that impact the bottom line need to be explored in depth.
Healthcare data analytics like the example above allow you to visualize current trends in your business such as actual and target revenue.
Healthcare data can be used to consider future implications of hospital revenue trends. Predictive analytics, while not the focus of these healthcare analytics dashboards, is possible with the right use and output of data. You could conceivably use the analytics dashboard above as part of a larger data wrangling project that could lead to predictions on future budgetary conditions of individual hospitals, regions and even specific doctors.
A healthcare analytics dashboard is built to be unique to each business, allowing accurate future budget planning. Healthcare costs are rising and pressure keeps mounting to reduce costs without reducing the quality of care.
Healthcare analytics provides real-world results to patient care
Scope is important when rolling out a data analytics plan. Use the healthcare metrics you’ve gathered prior to rolling out analytics and apply them to the real world. Patient data is one aspect to consider. By wrangling that big data, and visualizing it with analytics dashboards, you can create useful pictures of individual patients.
- Reduced redundant tests.One example of a great use of big data in healthcare is eliminating redundancy. Don’t you hate it when you go your own doctor or hospital and you find yourself taking tests that all seem to do the same thing? We’re sure you find it annoying when your own healthcare facility does it. It’s a waste of resources for you and does nothing to improve your patient’s stay. Not only that, redundant testing can also be a safety hazard to your patients. A study in the journal Health Affairs found that one of the sources for unsafe care in hospitals included redundant tests ordered by different doctors. The same study found that eliminating redundant tests could save the American health industry $8 billion dollars. Through healthcare analytics, though, you can merge all the data for a specific patient into one system. The key here is that by merging patient data makes it easier for doctors to use an EHR to view patient records. When they’re with the patient, a doctor can see all tests and treatments already administered. Your facility saves money, patients don’t have to deal with redundant tests, and doctors are free to care for patients more effectively. In many ways, this is a key importance of analytics in healthcare.
- Personalizing care. New analytics technologies are making it easier for you to access individual patient data. With access to personalized data comes the ability to run that data through healthcare analytics. Anyone experienced in the healthcare industry knows one aspect of this is talking with customers about their medical data and making appropriate decisions, but healthcare analytics can help personalize another, more surprising, aspect: cost trends. By relaying information in an easy to digest visualization, a healthcare analytics becomes an invaluable tool between staff and patients to convey the cost of treatment. Both staff and patients can use the same healthcare analytics dashboard, which ensures that communication remains clear. Ultimately, what you want to see is this information being used to help patients make the right decisions in their care. This results in a more complete picture of a patient’s needs and concerns. One of the benefits of analytics in healthcare is that it increases both access to individual patient data and opportunities to analyze that data. The day may come when healthcare analytics will make individual treatment regiments the norm over today’s broader, one-size-fits-all treatments.
The use of big data and analytics in healthcare is just going to become more common as time goes on. Now more than ever, you need to be ready to take the road of healthcare analytics and dashboards. Ready to see what your project looks like? Give us a call and take the first step.
Are you tasked with bringing your health plan operations into the future? Find out how to accelerate those efforts here!