What happens when some of the biggest names in insurance need help with their life insurance KPIs? That’s the topic of this blog. It’s based on recent engagements, right here at OpsDog, with some companies you know well. See if you can learn from their experience—and the top four KPIs we put to work for them.
As we’ve made clear in many of our recent blogs, business intelligence hinges on data. And by data, we mean ratios. We’re talking about life insurance KPIs.
What are life insurance KPIs?
Life insurance KPIs are defined as individual units of business measurement, or metrics, that track life insurance operational performance over a set period of time.
Life insurance performance metrics (also called KPIs) vary by work product and department within the company. These measurements are best implemented when segmented by different departments in life insurance companies; agency, underwriting, new business processing, policy administration, billing, information technology, and claims.
What, then, do we do when a life insurer wants us to scrutinize their policy-administration unit? We’ll propose that we wrangle several relevant life-insurance performance metrics that are hiding in their data. In this article, we’re going to spotlight the top four life insurance KPIs we studied for these clients, because you’ll find them just as useful as these industry leaders did!
Life Insurance KPI Number 1: Policy lapse ratio
You’d be surprised by the number of times an exchange like this occurs between OpsDog and our clients in the life-insurance business:
OpsDog: “Do you have any information on policy lapses?”
Client: “Yes.”
OpsDog: “Great! Where do you keep it?”
Client: “Uhhh…”
It’s not that they don’t have it. It’s just that it’s often jumbled. Not to mention messy.
We don’t care. We’re expert data cleaners and wranglers, so we surmount these challenges for our clients every day. Once we do, we can assemble important KPIs for them to track—like the policy lapse ratio.
This insurance agency KPI is a measure of how many policies fail to get renewed, compared to those that do. Yep—it’s a ratio, the most informative type of life insurance KPI. It shows how effective a policy administration unit is. It can reveal problems in customer service and billing, among other areas.
Customer service, sadly, often falls short in the life-insurance industry. That’s not good. It decimates KPIs like the policy lapse ratio. At least when you have a KPI like this in place, you can pinpoint shortfalls, and begin to make improvements.
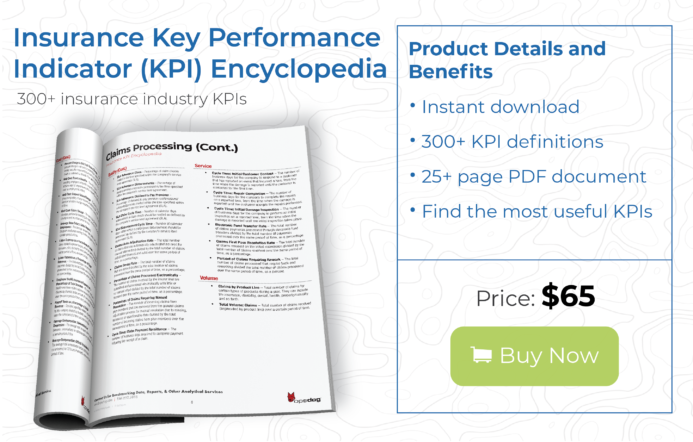
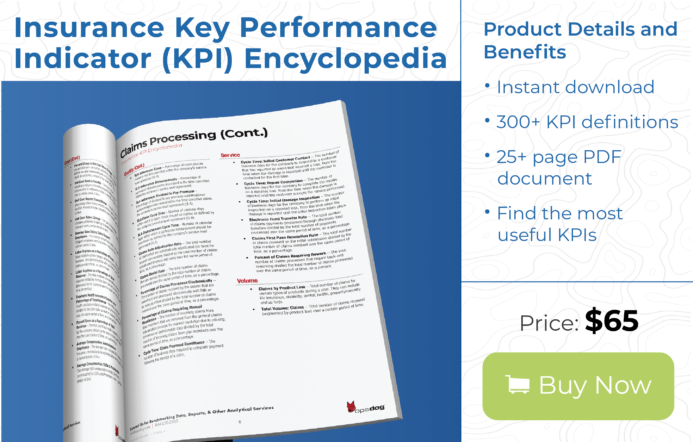
(Incidentally, OpsDog offers big lists of life insurance KPIs for you to download directly; we also offer custom services tailored to your needs.)
Life Insurance KPI Number 2: Average customer satisfaction
Speaking of customer service, we couldn’t stress its importance to the industry without suggesting ways to measure it, right? As an insurance agency KPI, average customer satisfaction is simple. It’s just the number of policyholders who are satisfied with a company, compared to the total number surveyed. (Another ratio! We love ‘em!)
This insurance agency KPI helps with the first one we’d just mentioned above: the policy lapse ratio. By drilling down to specific customer experiences, you can identify pain points easily. You can find, for example, shortcomings like inefficient billing practices or poor representative training. These are solid areas that you can work on to effect positive change.
What percentage of your customers are satisfied—or not? Perhaps it’s time you paid closer attention to this vital insurance agency KPI.
Purchase and Download Opsdog’s Life Insurance Policy Administration KPI Benchmarking Report to Compare Your Business To Peers Today!
Life Insurance KPI Number 3: Policies-in-force per employee
Want to see where productivity lies—or hides? This is the KPI for you. It’s a good volume metric.
The name explains it all. “Policies-in-force per employee” compares what you’re paying, in headcount, versus what you’re bringing in, in premiums. It’s vital for optimizing staffing levels. If it’s too low—that is, if the headcount doesn’t justify the expense—it may be time for a reset. Higher is better, but if it’s steadily rising, that may be an indication that you’ll soon need to staff up in order to maintain quality.
Remember: No KPI exists in a vacuum. You need the right combination of them in order to get an accurate picture of your company’s health. Properly wrangled and meta-tagged, data can better your company. It’s a strategy that has served us and our clients well (and that you can learn more about if you contact us for a quick call).
Life Insurance KPI Number 4: Policy admin cost per policy
You can’t administrate policies without spending money. (Alas!) But you can track what you’re spending—and adjust as needed. That’s where “policy admin cost per policy” comes in.
This insurance agency KPI measures the total cost of a policy administration unit, divided by the total number of policies. Simple as that. When you need to track your bottom line, this is one of the life insurance performance metrics you must measure. Obviously, you want it low. But a high number will at least open the door for new ideas.
Once it’s wrangled and clean, your data can hand you massive opportunities for improvement. You could find yourself with more efficient staffing, better customer service, or corrected billing practices. Better yet, you can find yourself with all of the above. Never settle for false tradeoffs!
Of course, there are more than four life insurance KPIs. But these should get you thinking. And acting! Download more of them right now, or have us come in and clean up your data and do it for you! Contact us right now to get started.