We’ve had more than our fair share of clients ask us about big data in HR and business intelligence. “We know that big data in HR exists,” they’ll tell us, “but does HR business intelligence mean anything for us?”
If you have questions along the same lines, congratulations! You’re part of the elite class of business professionals who know big data in HR even exists in the first place!
The fact of the matter is, your human resources department is already managing scads of data—both structured and unstructured. You have detailed employee data and profiles, performance review data, potential hire data, even data on disciplinary issues. And that’s just the tip of the iceberg.
This is all data that HR business intelligence thrives on, and that can lead to an effective and efficient HR dashboard. From a more bottom-line-focused perspective, translating all that information into KPI (that’s Key Performance Indicator) visualizations results in your being able to discover entirely new areas for optimization and tracking performance. If you’ve read our KPIs 101 series (and if you haven’t, you really should), you already know that KPIs are specific quantitative values which measure the effectiveness of your business. Their net benefit lies in their ability to serve both your employees and your company better.

How to wrangle big data in HR for an easier HR BI experience
We’ve said it once (well, actually twice—make that three times) and we’ll say it until we run out of room on the Internet: just having access to big data in HR is not enough. All the data in the world won’t help you if it’s not wrangled out of its raw form and compared in ways that give it purpose and meaning. Otherwise, you’ll end up feeling like you’re on a beach, sifting through massive piles of sand in a vain effort to uncover the minuscule differences between them.
Often, we find that companies understand this on principle, but don’t have the “practice” part down.
“Can you incorporate this particular KPI into the HR dashboard?” they’ll ask.
“Of course,” we reply. “Just show us the data.”
This is followed, all too often by a lull of sheepish silence. Not that it’s the fault of a company. Many times, their internal departments just aren’t equipped to handle the amount of data they have. This is certainly true of big data in HR BI.
Luckily for you, you can skip past the trouble with OpsDog. We’re old hats at data wrangling in HR. In fact, it’s one of our major services. We can work with your HR and IT departments to drill down to find only the most useful data that will result in the kind of HR report you want.
In short, wrangling data isn’t just an IT issue. Not to knock your IT department, but they will probably lack the HR operations experience to parse large amounts of data into the right insights. It’s not that there’s anything wrong with them; it’s just not in their wheelhouse. You can’t expect someone with a motorcycle license to fly an airplane.
What you need is a group of professionals that understands that wrangling big data in HR is a business challenge. Like OpsDog. We pride ourselves on our HR KPI acumen, which helps assign the correct information to an HR business intelligence project.
The best HR data is clean and structured data. You wouldn’t believe how many times we’ve entered the data-wrangling portion of an HR BI (that’s “business intelligence”) project and had to explain to a company that half (or more) of their data was useless for their needs. Not to mention the work that goes into making data ready for implementing into an HR dashboard. Eighty percent of the time, you’re manually tagging data with more metadata to make it useable at all.
Wrangling big data in HR is a huge task, to be sure. But trust us when we say it’s worth it. Because after that data is clean and enriched, you can feed a crazy amount of it into an HR business intelligence project. The great thing about BI is that it’s incredibly unlikely, arguably impossible, to overload it if the data and inputs are structured correctly.
Even clean data, however, isn’t the end of your optimization journey.
The right HR key performance indicators will do the big data work for you
KPIs are an integral part of any HR business intelligence project.
If you’ve taken the time to read our latest articles on this topic, you’ll know that KPIs are not all equally important. In fact, when it comes to using big data in HR to create a business intelligence dashboard, not all KPIs are going to give you what you want. The success of a project often comes down to your ability to choose the right KPIs for your needs.
Good news: OpsDog can be your secret weapon. The following two examples come from real experiences we’ve had creating HR business intelligence reports. Of course, we’ve scrubbed names for client privacy in this blog. Just know, you can get your own custom HR dashboard, too. Just ask.
A note: This project focused on some of the more traditional data available to an HR department. However, just like our custom services suggests, your own project could vary depending on your needs. With the amount of data your HR department has access to, it really comes down to your individual business.
With that said, let’s look at some of the possibilities in HR business intelligence.
Examples of human resources KPIs for HR business intelligence
Using HR business intelligence, we can create efficient visualizations of big data in HR.
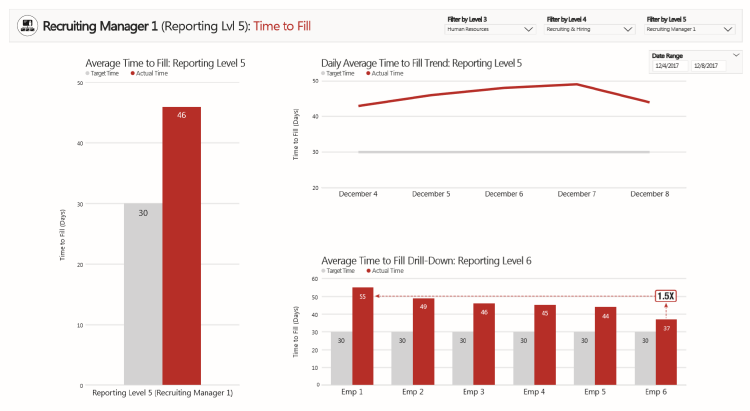
Let’s get one thing out of the way. “Time to fill” does not mean “time to hire.” The first KPI measures the time between making a job opening public and having a job offer accepted. “Time to hire,” on the other hand, focuses more on the time between an approved candidate first contacting you and their hire.
Seems like a small difference, right? Nope.
You see, “time to fill” as an HR KPI is a measure of how long the entire filling process takes. “Time to hire,” by contrast, focuses on how fast your department moves in on the right candidate once they’re found.
You’re probably asking yourself, “So what does that mean for HR business intelligence?”
We’ve seen it many times: Companies eager to grow, but underestimating the length of time the hiring process will take. Or, inadvertently sabotaging themselves with ineffective use of job-posting channels, cumbersome recruiting processes, and recruiters that aren’t producing the results they want. When used in a larger HR business intelligence dashboard, this KPI will help you measure the effectiveness of your HR department’s recruiting measures. Tracking this KPI on an ongoing basis visually helps you review recruiting trends over time.
When you use big data in HR to create a business intelligence dashboard, though, you get some additional perks. Need an example? Look at the picture above. See the section called “Average Time to Fill Drill-Drown?” That’s one of those perks we just mentioned. With an HR dashboard, you can use sections like that to answer some common questions: How different is the time to fill time-lapse between individual employees? What’s the difference between my target time and actual time?
Historical trends offer their own keen insight in HR business intelligence.
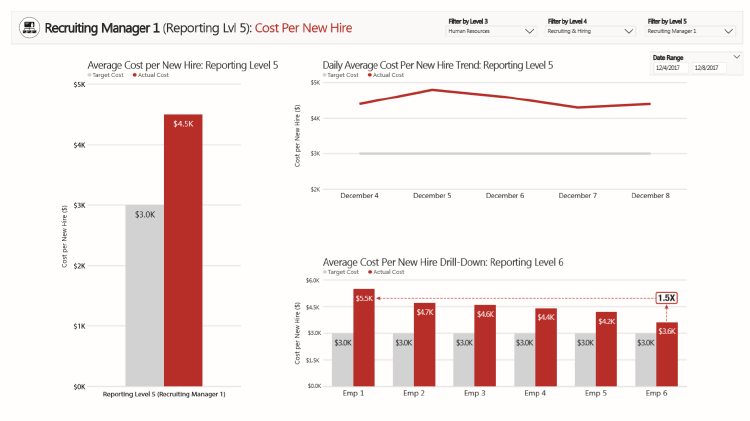
Sometimes you just need to be straightforward. That’s where a KPI like “cost-per-new-hire” comes in. Basically, you’re measuring the cost of the recruiting-and-hiring process, divided by the number of filled positions during the same period of time. (Of course, you knew that.)
Why are we including this KPI as an example? Precisely because of its straightforward nature. Need a relatively simple way to measure the effectiveness of your HR department? This might be it.
This HR dashboard sample has all the hits. Look at the line graph. See how we can drill down on trends as specific as a day-to-day basis? And although this particular example doesn’t show it, OpsDog also gives you the power to kick-start predictive analytics—and see trends into the future. It’s just a question of letting us know what you want and working with us to identify the right data to wrangle.
What are the benefits of including “cost-per-new-hire” in an HR business intelligence project? It helps measure the efficiency of your recruiting practices. Consider:
- Is your candidate screening effective?
- Are you marketing your open positions through the most appropriate channels?
- Are your job requisitions well-written?
Wrangling the right big data in HR for this KPI will help answer those questions and more.
Visually tracking this metric, by the way, lets you review spending trends over time. It will help you measure that spending against goals. It will benchmark your cost-per-new-hire, literally per new hire. And even further, you can use it to set targets for future performance.

Performance improvement and big data in HR
We know nothing escapes your attention. That’s why you’ve probably noticed how much the result of a good HR business intelligence project is geared toward performance improvement.
In fact, one of big components that OpsDog is routinely tasked with creating, in the course of our client engagements, is improvement databases. These interactive reports describe potential process improvement in your business and associated leading practices to follow. We’ve included an example below for you to see.
You’ll notice right off the bat that the improvement opportunities are culled directly from your company’s data. That’s the beauty of big data in HR—and data wrangling in general. Everything is personalized to a level that truly works for you.
The main benefit of these databases is that they build a straight line between where you are now and where you want to be. Have you ever felt frustrated because you know there’s a problem, but don’t know what steps to take to fix it? Or you feel surrounded by potential improvement opportunities and don’t know where to start?
Yeah, we thought so.
That’s why we spell things out in an easy-to-follow report. We look at the data, then prioritize and organize it so you know how to proceed in manageable steps. We’ve generated tons of these reports for clients worldwide, and would be delighted to help you out with yours too. (Contact us!)

We make sure to lay out things as simply and efficiently as possible. It makes it easier for you know exactly what your data is telling us.
At the end of the day, HR business intelligence can’t exist without big data. It certainly can’t be as effective. Are you ready to ride the big data in HR wave for your own project? Contact us to get started.