Banks today face an ever-changing landscape, challenges arise in multiple areas and a risk in one area can easily impact another. According to ABA Banking Journal the security and cyber risks remain at the top of the risk lists in most banks. No matter the size of the a financial institution there is always a cybersecurity risk to consider, banks must monitor technology upgrades to ensure that criminals can’t target vulnerabilities in the system.
There are other risks to consider aside from the threat of ransomware and other cyber criminals. The continuously shifting political climate can effect credit ratings. Financial Times references the effect that Brexit could have on financial institutions in the UK and the EU. Many banks already have a plan in place in case the outcome of Brexit is messy, in fact some banks even have plans in place to move staff and operations due to the economic climate in the UK.
Cybersecurity, political climate, third party relationships, regulatory uncertainty, rising interest rates, talent management, and more all vie for the attention of banks. All of the before-mentioned risks have always been important areas of focus for risk management teams as they all can tie into compliance risk. The ABA Banking Journal lists many acts that bank’s must work to comply with, such as the Bank Secrecy Act, which deals with cybersecurity and data integrity, and others such as the Home Mortgage Disclosure Act to monitor lending practices. Risks are related, sometimes obviously and sometimes subtly, but all risk should be monitored and plans to react should be in place.
What are key risk indicators for banks?
Key risk indicators (KRIs) are defined as a quantifiable measurement used by bank management to precisely and accurately evaluate the potential risk exposure of a certain activity or process and how it will impact various areas of a financial institution using models and mathematical formulas.

KRIs are used to provide an early warning, instead of measuring something that has already happened. These indicators are used by financial institutions of all sizes to predict risks that impact the business or to provide a backward view on risk events to apply to future ventures. With recent technological advances risk can be measured in real-time, providing risk management teams with the tools to judge the bank’s tolerance for risk and create risk mitigation plans in case any issues arise. Key risk indicators for banks can also help to track trends in the organization, these trends can be used to locate opportunities for future investment or to identify areas where the risk wouldn’t be worth the reward.
Simply put, key risk indicators for banks are metrics used by risk management employees to provide early warnings about the risk potential of processes across the organization to determine where to invest in the future and to find out how tolerant to risk an institution is.
What is a list of sample key risk indicators
A list of sample key risk indicators for banks is defined as a curated list of risk indicators that have been identified as important to the financial institution, adequately measure risk and control, and can be referenced by all employees evolved with the risk management team. This list should be based on already established benchmarks and allows for comparison over time and between business areas.
How to use a list of sample key risk indicators
A list of effective KRIs can be used, and provide benefit, by improving risk reporting. To effectively utilize a list of key risk indicators for banks you must start with a balanced selection of risk indicators and ensure that these metrics target the root cause of the events you are measuring. Tracking KRIs on your list will allow for prediction of failure, so that you can avoid that future by allotting more resources, provide employee training, or apply other methods to fix the problem before it becomes something much worse. Using KRIs allows you develop risk mitigation plans, which provides an action plan to reduce threats to business objectives and enhancing opportunities for success in your bank.
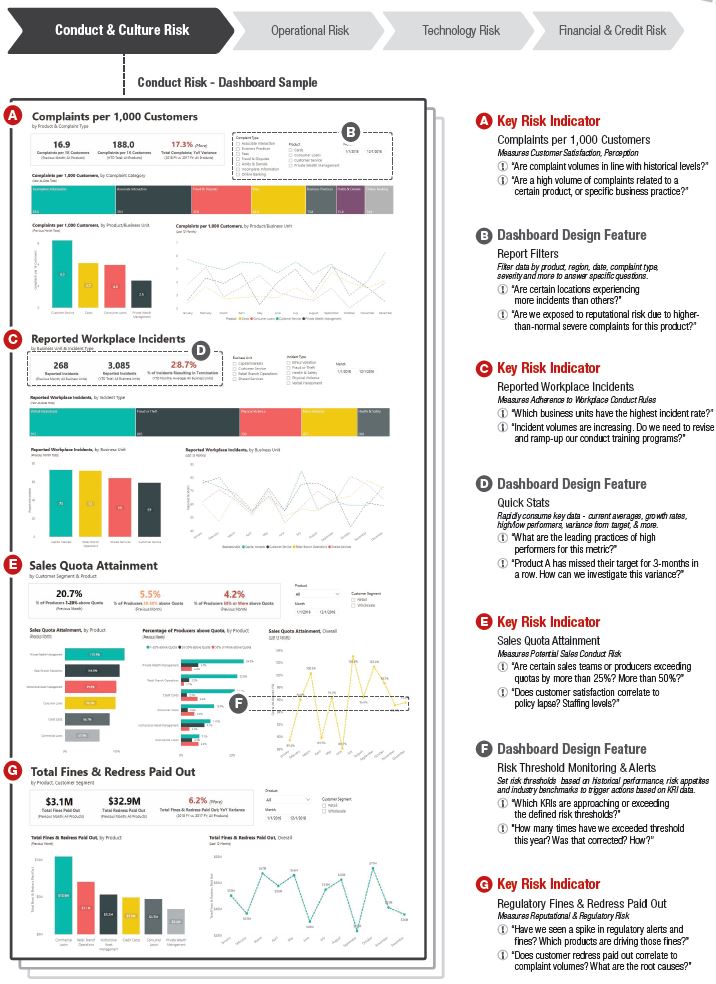
Banking Key Risk Indicator Dashboard
Once you have your list of key risk indicators narrowed down, you can load them into you dashboard software. Microsoft Power BI is our top pick, but Tableau and Domo work equally as well. If you need help creating one, like we did for one of our customers below, reach out.
List of Key Credit Risk Indicators for Banks

Credit Risk Indicator Example # 1 – Value at Risk (VaR)
Type of Risk – Investment Risks
Definition – The amount of potential losses (dollar value) that the company could incur if certain positions held by the organization were to lose a certain amount of value. Value at Risk (VaR) is based on the probability that losses will occur within a given investment portfolio over a given period of time and can be calculated using historical data and/or proprietary models.
Rationale for measuring this KRI – This metric measures the organization’s exposure to potential losses, and may gauge the amount of cash the firm must have on hand to cover these losses. A high dollar value at risk, especially when compared with cash reserves and liquidity, may indicate that the firm is taking on more risk than desired in regards to their overall investment portfolio. This may expose the organization to risk related to loss of revenue and potential reputational harm due to poor investment strategies.
Credit Risk Indicator Example # 2 – Current Ratio
Type of Risk – Liquidity Risks
Definition – A measure of the organization’s current liquidity, expressed as a ratio of total current liquid and illiquid assets to current liabilities.
Rational for measuring this KRI – This metric measures the company’s ability to pay off its current liabilities using the assets the total assets available. A low value metric, particularly a value less than 1, indicates that the organization has taken on a large amount of liability that cannot be covered by its current assets. This may expose the organization to risk related to not being able to meet financial obligations, as well as all of the financial and reputational penalties that accompany that distinction.
Credit Risk Indicator Example # 3 – Quick Ratio
Type of Risk – Liquidity Risks
Definition – a measure of the organization’s current liquidity, expressed as a ratio of total current liquid assets to current liabilities.
Rational for measuring this KRI -This metric measures the company’s ability to pay off its current liabilities quickly using the company’s liquid assets. A low value for this metric, particularly a value less than 1, indicates that the organization has taken on a large amount of liability that cannot be covered by its current assets. This may expose the organization to risk related to not being able to meet financial obligations, as well as all of the financial and reputational penalties that accompany that distinction.
Credit Risk Indicator Example # 4 – Days Payable Outstanding (DPO)
Type of Risk – Credit Risks
Definition – The number of calendar days required for the organization to pay off its accounts payable balance.
Rational for measuring this KRI – This metric measures risk related to meeting short-term financial obligations, typically with the company suppliers, or vendors. A low DPO number may lead to cash flow issues (i.e., paying suppliers too quickly), but a high DPO (i.e., taking too long to pay suppliers) may adversely effect credit terms that have been negotiated with certain suppliers. The Accounts Payable department must find a balance that best suits the company’s liquidity requirements.
Credit Risk Indicator Example # 5 – Percentage of Invoices Paid On-Time
Type of Risk – Credit Risks
Definition – The number of invoices paid on-time as a percentage of the total number of invoices paid during the measurement period.
Rational for measuring this KRI – This metric measures risk associated with the organization’s adherence (or lack of adherence) to established credit terms, as specified in the terms of the invoice, or in supplier contracts. An excessive volume of late invoices may adversely effect credit terms that have been negotiated with certain suppliers. In addition, certain suppliers may provide discounts for repeatedly paying bills on-time or early (i.e., cost avoidance).
List of Key Operational Risk Indicators for Banks

Operational Risk Indicator Example # 1 – Percentage of Projects Currently in Progress That are Delayed (Overall)
Type of Risk – Project Risks (Mega Projects)
Definition – The number of projects that are currently in progress that are delayed as a percentage of the total number of projects that are currently in progress at the time of measurement.
Rational for measuring this KRI – This metric measures the risk associated with project delays. A high rate of delayed projects may indicate that the organization has issues related to project planning, resource allocation or capacity, project execution, budgeting, and overall project management. Excessive project delays expose the organization to financial, strategic, operational and reputational risk.
Operational Risk Indicator Example # 2 – Percentage of Departments without Defined Key Performance Indicators (KPI) in Place
Type of Risk – Strategy Risks
Definition – The number of departments (i.e., business units or organizational functions) that do not have defined Key Performance Indicators (KPIs) in place at the time of measurement as a percentage of total departments within the organization.
Rational for measuring this KRI – This metric measures the organization’s dedication to assigning performance metrics that are significant to departmental areas. Defining KPIs for departments provides formal structured measurement tools that will make it easier for managers to perform reliable analysis on the department’s performance. Without defined KPIs, managers may waste their time analyzing insignificant performance metrics and developing insights that don’t improve departmental operations.
Operational Risk Indicator Example # 3 – Percentage of Key Performance Indicator (KPI) Targets Not Met – Overall
Type of Risk – Strategy Risks
Definition – The number of departmental Key Performance Indicator (KPI) targets not met by the organization during the measurement period as a percentage of the total number of KPI targets defined by the organization.
Rational for measuring this KRI – This metric measures the degree to which KPI targets are being achieved by the organization. Meeting KPI targets should increase the likelihood that departments or employees are performing to a standard that aligns with the greater strategic goals of the organization. Failure to meet defined KPI targets may expose the company to operational, financial and reputational harm due to subpar employee performance.
Operational Risk Indicator Example # 4 – Number of Accounting Deadlines Missed -External
Type of Risk – Financial Reporting Risks
Definition – The total number external accounting deadlines for regulatory filings missed during the measurement period.
Rational for measuring this KRI – This metric measures the potential risk that stems from failing to meet deadlines for regulatory accounting filings and fees. Failure to meet regulatory these deadlines may result in fines, written warnings, or revocation of company or individual credentials. Each of these factors may inhibit the organization’s ability to operate in certain realms, impact the organization’s standing with regulatory authorities, and/or lead to avoidable fee payments.

Operational Risk Indicator Example # 5 – Number of Accounting Deadlines Missed -Internal
Type of Risk – Financial Reporting Risks
Definition – The total number of internal accounting deadlines to management missed during the measurement period.
Rationale for measuring this KRI – This metric measures the potential risk that stems from failing to meet managerial (i.e., internal) accounting deadlines. Failure to meet managerial accounting deadlines can adversely affect the organization by restricting management’s knowledge of company operations, which may in turn inhibit management’s decision-making capabilities particularly in regards to organizational liquidity, investments and/or budgeting activities.
Operational Risk Indicator Example # 6 – Number of Regulatory Report Restatements
Type of Risk – Financial Reporting Risks
Definition – The total number of report restatements related to external regulatory financial reports during the measurement period.
Rational for measuring this KRI – This metric measures risk that stems from the submission of regulatory reports with errors, omissions, or other inaccuracies. Erroneous or incomplete regulatory reports may result in regulatory penalties/fines, diminished relationships with regulators or auditors and reputational harm (if errors are made public). Any rework related to report restatements may also impact organizational capacity and detract from the day-to-day duties of the finance function.
Operational Risk Indicator Example # 7 – Number of Management Report Restatements
Type of Risk – Financial Reporting Risks
Definition – The total number of report restatements related to internal financial reports for management during the measurement period.
Rational for measuring this KRI – This metric measures risk that stems from the use of management reports with errors, omissions, or other inaccuracies that may lead to a misrepresentation of the financial well-being of the organization. Erroneous or incomplete financial management reports may inhibit management’s decision-making capabilities, particularly in regards to organizational liquidity, investments and/or budgeting activities. Any rework related to report restatements may also impact organizational capacity.
Operational Risk Indicator Example # 8 – Total Number of Post-Close Adjustments
Type of Risk – Financial Reporting Risks
Definition – The total number of post-close adjustments performed during the measurement period.
Rational for measuring this KRI – This metric measures the risk that may stem from a high volume of required post-close adjustments. Post-close adjustments are typically related to errors or omissions within the initial accounting journals, reports and related outputs, which may indicate that the organization does not have the appropriate accounting controls in place, and/or that established accounting standards are not being adhered to. Excessive post-close adjustments may also impact organizational capacity (due to rework).
Operational Risk Indicator Example # 9 – Percentage of Journal Entries Performed Manually
Type of Risk – Financial Reporting Risks
Definition – The number of journal entries performed manually as a percentage of the total number of journal entries performed during the measurement period.
Rational for measuring this KRI – This metric measures the risk associated with any highly-manual journal entry process. A high rate of manual work within the journal entry process, and related accounting processes, vastly increases the likelihood of errors, omissions and unauthorized activity (e.g., unapproved items, etc.) within journal entry and general ledger management processes. Manual journal entries may also increase cycle times and costs associated with any related accounting functions.
Operational Risk Indicator Example # 10 – Number of Detected Deviations from GAAP
Type of Risk – Financial Reporting Risks
Definition – The total number of detected deviations from Generally Accepted Accounting Principles (GAAP) during the measurement period.
Rational for measuring this KRI – This metric measures the risk that stems from any deviation from GAAP within accounting and financial reporting processes. Lack of adherence to GAAP may result in financial reporting errors, potential fraud and regulatory issues (fines, penalties) which expose the organization to both financial and reputational harm. Poor practices within this area may also impact organizational capacity due to excessive rework (time required to correct accounting errors, adjust processes, etc.).
Operational Risk Indicator Example # 11 – Percentage of Vendor Payments with an Approved Purchase Order
Type of Risk – Fraud Risks
Definition – The number of vendor payments that have an approved purchase order as a percentage of the total number of vendor payments made.
Rational for measuring this KRI – This metric measures the controls in place to mitigate risk related to potentially unauthorized invoice payments made to company vendors, or suppliers. If a vendor payment has an approved purchase order, it helps to ensure that the purchase has gone through the necessary steps within the organization required to approve and process payment.
Operational Risk Indicator Example # 12 – Budget Variance (Budgeted vs. Actual) – Firm-Wide
Type of Risk – Liquidity Risks
Definition – The monetary difference between the organization’s budgeted expenses and the actual expenses for a given measurement period.
Rational for measuring this KRI – This metric measures the risk associated with cost underestimation or overestimation that may lead to issues regarding short-term fulfilling liquidity, and/or the allocation of capital across the organization. Budget variance can also indicate out-of-date or inaccurate forecasting methods or a changing business environment, which may lead to additional uncertainty and diminished confidence related to budgeting and forecasting processes.
Operational Risk Indicator Example # 13 – Maverick Spend Rate
Type of Risk – Revenue & Profit Risks
Definition – The total dollar amount of spending that, in any way, does not meet the company’s defined purchasing requirements, as a percentage of total purchasing spend over the same period of time.
Rational for measuring this KRI – This metric measures the company’s adherence to purchasing standards and the effectiveness of the controls in place to reduce deviation from those standards. Unauthorized “maverick” spending may expose the organization to vendor fraud, higher than negotiated pricing for goods/services, uncertain quality of delivered goods/services and cost overruns within certain business units. Organizations with poorly defined and communicated purchasing processes may experience high “maverick” spending rates.
Operational Risk Indicator Example # 14 – Percentage of Post-Audit Report Recommendations Still Outstanding – Overall
Type of Risk – Corporate Risks
Definition – The number of post-audit report recommendations that are still outstanding (i.e., have not been implemented) as a percentage of the total number of post-report audit recommendations made during the measurement period.
Rational for measuring this KRI – This metric measures the diligence in which the organization implements the recommendations that are made during the audit process. A high value for this metric indicates that the organization is not carrying out post-audit report recommendations in a timely manner. Since the purpose of these audits is to mitigate the regulatory and legal risk exposure of the organization, a high value leaves the company more vulnerable to regulatory, legal and, as a consequence, financial risk.
Operational Risk Indicator Example # 15 – Number of Notifications Received from Regulators
Type of Risk – Corporate Risks
Definition – The total number of notifications that the organization receives from regulators during the measurement period.
Rational for measuring this KRI – This metric measures the diligence of the organization in complying with the rules and procedures put forth by relevant regulatory bodies. High values for this metric are indicative of a high number of compliance policy breaches and poor employee compliance training practices. A high volume of notifications can be a lagging indicator of poorly developed compliance controls and may expose the organization to financial, reputational and operational risk if left unchecked.
List of Key Technology and Cyber Security Risk Indicators for Banks

Technology and Cyber Security Risk Indicator Example # 1 – Mean Time Between Failure (MTBF)
Type of Risk – Technology Infrastructure Risks
Definition – The average amount of time (measured in days) elapsed between system failures, measured from the moment the system initially fails, until the time that the next failure occurs (including the time required to perform any repairs after the initial failure).
Rational for measuring this KRI – This metric measures the stability of systems following a resumption of service (i.e., a repair following a failure), as well as the IT function’s ability to regularly develop and release stable services (initial releases and changes). A large value for this metric may indicate that systems are unstable and underlying architecture must be further examined. This is particularly vital for critical customer-facing systems.
Technology and Cyber Security Risk Indicator Example # 2 – Mean Time to Repair (MTTR)
Type of Risk – Technology Infrastructure Risks
Definition – The average amount of time (measured in hours) required to repair a system or application to full functionality following a failure (i.e., a service interruption), measured from the time that the failure occurs until when the repair is completed and rolled out to all required locations (servers, devices, workstations, etc.).
Rational for measuring this KRI – This metric measures the IT function’s ability to respond to and resolve a system or application failure, or service interruption, and ensure that the resolution is rolled out to all required workstations, devices, servers, etc. A large value for this metric may indicate that the IT function’s response procedures are lacking and/or that systems are not built in such a way that facilitates speedy debugging and recovery.
Technology and Cyber Security Risk Indicator Example # 3 – System Availability
Type of Risk – Technology Infrastructure Risks
Definition – The amount of time (measured in minutes) that ALL systems are online and available for use by all authorized users divided by the total amount of time those systems are scheduled to be available for use over the same period of time, as a percentage.
Rational for measuring this KRI – This metric measures the overall performance and uptime of systems. System service interruptions/failures expose the company to reputational, financial and operational risks. This value should be near 100%, as system downtime can directly relate to lost revenue, poor productivity and decreased client satisfaction.
Technology and Cyber Security Risk Indicator Example # 4 – IT Service Provider SLA Adherence
Type of Risk – IT Planning and Performance Management Risks
Definition – The number of IT vendor service level agreements where the vendor has met or exceeded targets outlined in their corresponding Service Level Agreement (SLA) over the last 3 months as a percentage of total vendor, or service provider, activities and performance levels are governed by a formal SLA.
Rational for measuring this KRI – This metric measures vendor management and compliance practices, and related risk arising from poor vendor performance and lack of oversight. Vendor performance should be governed through Service Level Agreements (SLAs) and diligent project management. Furthermore, SLAs should define specific metrics and performance criteria to assess the performance of long-term vendor relationships.
Technology and Cyber Security Risk Indicator Example # 5 – Internal IT Team SLA Adherence
Type of Risk – IT Planning and Performance Management Risks
Definition – The number of internal service level agreements where the IT team has met or exceeded targets outlined in their corresponding Service Level Agreement (SLA) over the last 3 months as a percentage of total IT team activities and performance levels are governed by a formal SLA.
Rational for measuring this KRI – This metric measures IT team service performance, management and compliance practices, and related risk arising from poor performance and/or lack of oversight. IT service performance should be governed through Service Level Agreements (SLAs) and diligent project management. Furthermore, SLAs should define specific metrics and performance criteria to assess the performance of the IT group.
Technology and Cyber Security Risk Indicator Example # 6 – Percentage of Critical Systems without Up-to-Date Patches
Type of Risk – Technology Infrastructure Risks
Definition – The total number of critical systems (all deployed instances of the system or application running on each device/workstation) that do not currently have up-to-date patches installed and running as a percentage of total critical system end user devices/workstations. This metric may also be known as “Patch Coverage Rate.”
Rational for measuring this KRI – This metric measures the IT function’s ability to efficiently and successfully roll out patches to all required end points. Poor patch and change management practices expose the company to risk related to un-patched security vulnerabilities and system/application shortcomings (instability, poor user experience, etc.).
Technology and Cyber Security Risk Indicator Example # 7 – Percentage of Systems in Use that are No Longer Supported
Type of Risk – IT Development Risks
Definition – The number of systems currently in use by the company that are no longer supported by the original developer as a percentage of total systems used by the organization at the same point in time. These non-supported systems may also be considered “legacy” systems.
Rational for measuring this KRI – This metric measures risk related to software that is no longer supported by the original developer, meaning that they no longer release updates to address security, usability and/or performance issues, which leaves the company open to risk in those areas.
Technology and Cyber Security Risk Indicator Example # 8 – Percentage of Network Devices Not Meeting Configuration Standards
Type of Risk – Telecommunications and Connectivity Issues
Definition – The total number of network devices (modems, routers, switches, etc.) that were found not to be in compliance the company’s pre-defined configuration standards as a percentage of total network devices under management at the same point in time.
Rational for measuring this KRI – This metric measures the IT function’s diligence in ensuring that network devices are configured properly. Improper configuration can lead to increased risk related to security incidents (internal and external), network performance degradation and network outages.
Technology and Cyber Security Risk Indicator Example # 9 – Percentage of Security Incident False Positives
Type of Risk – Internal Threats
Definition – The percentage of incidents in which security systems and protocols raised a false alarm of an attack when later analysis determined that none had occurred.
Rational for measuring this KRI – This metric measures the accuracy of security systems and protocols in analyzing system events and making determinations of whether or not illegal activity is occurring on a network. Ideally, this number should be as low as possible. A larger value of this metric will indicate that IT professionals are not able to effectively recognize signs of a genuine attack. This could result in an attack raising no alarms at all, as well as generate complacency about warning signs raised by an IT system.
Technology and Cyber Security Risk Indicator Example # 10 – Percentage of Devices Not Covered by Monitoring Solutions
Type of Risk – External Threats
Definition – The number of devices not currently covered by the company’s installed IT security monitoring solution as a percentage of total devices managed at the same point in time.
Rational for measuring this KRI – This metric measures the current coverage of managed devices in regards to the monitoring of security threats. A large value for this metric leaves the organization to attacks from all vectors for any device that is not currently covered, which obviously exposes the company to frisk on all fronts due to possible service interruptions, data leaks, etc.
Technology and Cyber Security Risk Indicator Example # 11 – Percentage of Employees Receiving Core Information Security Training Within the Last Year
Type of Risk – External Threats
Definition – The number of employees receiving core information security training within the past year as a percentage of total employees who received core information security training.
Rational for measuring this KRI – This metric measures knowledgebase of employees concerning information security as well as which employees are in need of further training. By enforcing periodic training sessions, the IS function is able to ensure employees are aware of current policies and procedures to follow.
Technology and Cyber Security Risk Indicator Example # 12 – Percentage of Passwords Currently Not Adhering to Password Quality Standards
Type of Risk – Data Integrity Risks
Definition – The total number of monitored application/system passwords that are not adhering to password quality standards (length of password, character diversity used, etc.) as a percentage of the total number of passwords monitored at the same point in time.
Rational for measuring this KRI – This metric measures the vulnerability of a company’s data and the IS function’s ability to detect and resolve issues concerning passwords that are not adhering to password quality standards. Weak passwords make it all the more easier for security incidents to occur and sensitive data to be used, manipulated or leaked.
Technology and Cyber Security Risk Indicator Example # 13 – Percentage of Employees Passing Internal Email Phishing Test
Type of Risk – External Threats
Definition – The number of employees who pass the internal email phishing test as a percentage of the total number of employees who participate in the internal email phishing test during the measurement period.
Rational for measuring this KRI – This metric measures the employees’ vulnerability of being defrauded by email phishing scams into releasing private information such as usernames, passwords, or credit card information, which could potentially be harmful to the individual or the organization. Employees who fail this test should be subject to additional training related to identifying email phishing attempts.
Technology and Cyber Security Risk Indicator Example # 14 – Percentage of ALL Employees Whose Access Rights Have Been Reviewed Within the Last 90 Days
Type of Risk – Internal Threats
Definition – The number of employees whose access rights have been reviewed within the last 90 calendar days as a percentage of the total number of company-wide employees.
Rational for measuring this KRI – This metric measures the risk associated with certain employees potentially having network access rights that they should not be granted. If an employee has access to files or network rights that they should not be granted, there is a greater risk to the company of information leaks, or other potential data breaches, whether intentional or unintentional.
Technology and Cyber Security Risk Indicator Example # 15 – Mean Time to Incident Detection
Type of Risk – Internal Threats
Definition – The average amount of time (measured in minutes) required for the network administrator to detect a security incident from the time that the incident occurs until the time that the security incident is detected by the network administrator.
Rational for measuring this KRI – This metric measures the risks associated with undetected security incidents by an organization’s network administrator. When a security incident is undetected, the network administrator cannot take any action to block the threat or mitigate any damage that the security incident has already incurred.