Key risk indicators for information technology can be utilized for a wide variety of industries, but for this post we will be focusing on KRIs for IT departments within the banking industry. Banks today are heavily integrated with technology to connect with their customers and because of this, privacy breaches are a very real risk.
For financial services organizations, a technology failure due to a cybersecurity breach or a service outage can have a devastating impact on the business and its customers. A failure can cause reputational damage, legal liability, and compliance and regulatory penalties. Technology benchmarks serve as an early-warning signal that can minimize the risk of technology not performing as expected.
What is a Key Risk Indicator (KRI) for Information Technology Services?
Key risk indicators (KRI) for information technology services are metrics that help banks manage risk in regards to the technology services department, whether the risk is financial, reputational, or compliance. Using KRIs, banks can analyze the risk of any technological decision, as well as the impact of privacy/security breaches or other IT issues on other bank processes.
Bank IT departments can use a wide-variety of technology-focused KRIs to build benchmarks that measure the risk of security breaches, system outages, server speed slowdowns, lack of adherence to service level agreements (SLA), and failure to update malware, and many others.
How Technology Benchmarking Can Help Manage Risk for Banks
Technology is a key enabler for banks, but has also become more complex with mobile devices, an increase in the number of applications banks must manage, more sophisticated hackers, and newer technologies such as artificial intelligence (AI) and robotic process automation (RPA). With so many moving parts and advanced technologies, managing risk has become more critical—and even more challenging.
Banks also have to manage the risk of aging legacy systems. Banks often only have time to put out fires—patching holes and addressing compliance shortfalls—rather than upgrading systems to prevent issues from arising. Although those banks that do upgrade their infrastructure still face risks related to these changes.
Most of technology risk management has been reactive, with banks viewing technology risk as a compliance check-the-box activity rather than as a way to add value to the business. Benchmarking key risk indicators for information technology allows banks to take a proactive approach to risk management—minimizing risk and using measurements to make strategic technology decisions such as how much money to invest in IT infrastructure.
Benefits of Benchmarking for Information Technology Departments in Banks
Technology benchmarking enables bank IT departments to make better decisions regarding technology. For example, benchmarking can answer questions such as: Is it more cost-effective to retire a legacy system when factoring in support and maintenance costs? How often is IT staff putting out fires versus proactively improving system functionality to meet business requirements? How often are business users unable to get their work done due to system outages? Does the IT organization need to revamp its procedures for emergency change management? Are there security holes that make the bank vulnerable to a cyber-attack?
Benchmarking with key risk indicators for information technology helps to identify potential improvements in both the technology used and the way the IT department is staffed, organized, and managed.
Technology Risk Benchmark Examples for Bank IT Departments
Key risk indicators for information technology benchmarks can cover a wide range of technological issues, from maintenance to utilization to system downtime. Here are five technology services KRI benchmarks commonly used by banks.
Technology Key Risk Indicator Benchmark #1: Mean Time Between Failures (MTBF)
Mean time between failures (MTBF) measures the average number of days a system functions before failing. Failure doesn’t necessarily mean a complete shut-down; a failure can also mean that there is an issue that is causing a slowdown in system performance or when the system isn’t delivering expected results.
To calculate the mean, total the numbers days from system failure, including the time it takes to repair the systems, until the next failure divided by the number of system failures. If the average time between system failures is shorter than acceptable, IT departments can revisit their preventative maintenance schedule, update system documentation, increase employee training, and even look at revamping system design.
Technology Key Risk Indicator Benchmark #2: System Availability (Severity I)
The holy grail of system availability is the “five 9s” meaning that a system is operational 99.999% of the time it is scheduled to be available, not including scheduled downtime. Divide the number of minutes the system was online and available to all authorized users by the time the system was scheduled to be available, as a percentage, to calculate system availability.
Every system will have a different system availability goal. A non-critical system that doesn’t directly impact customers such as an internal reporting system likely has a less stringent system availability goal than a mission-critical system like online banking.
Technology Key Risk Indicator Benchmark #3: Percentage of Emergency Changes
The most common emergency change is having to install a security patch to resolve a major security incident. Since emergency changes—as the name implies—have to be done quickly, there’s less time to test the change before deploying it, which can cause unintended consequences and risks.
To calculate, divide the number of emergency changes by the total number of changes, as a percentage. Obviously, the lower the percentage of emergency changes, the better. After every emergency, IT departments should decide if the change really was an emergency and how to prevent these types of changes from becoming emergencies in the future.
Technology Key Risk Indicator Benchmark #4: IT Security Incidents per IT Security Employee
One of the greatest technology risks for banks isn’t the technology itself, but human error. Employees losing laptops or mobile phones, employees not reporting security incidents, and even untrained employees are some of the top causes of security events. Having clear security protocols in place and employee training can reduce the number of incidents.
To calculate, divide the number of IT-related security incidents by the number of employees working within the IT security function. These incidents might vary in severity, so be sure to determine the seriousness of each incident and treat it accordingly.
Technology Key Risk Indicator Benchmark #5: Mean Time to Repair
This benchmark measures the amount of time it takes the IT department to fully fix a system failure—including rolling out the fix to all workstations, devices, and servers—measured from the moment the failure occurs until the repair is complete. To calculate the mean, or average, divide the total number of hours of time it takes to fully fix issues divided by the number of repairs.
If the mean time to repair critical system failures is unacceptably high, likely issues include lack of employee training and response procedures, too few staff, and not fixing the root cause but simply patching the problem.
Final Thoughts
Technology allows banks to compete and survive in a saturated field—but it also presents the potential for high-impact risk due to cyber-attacks, system outages, overloaded networks, data loss, compliance penalties, and the data breach risk of running outdated technology. Benchmarking key risk indicators for information technology allows banks to identify and mitigate these risks as well as use technology more strategically to boost the bottom line.
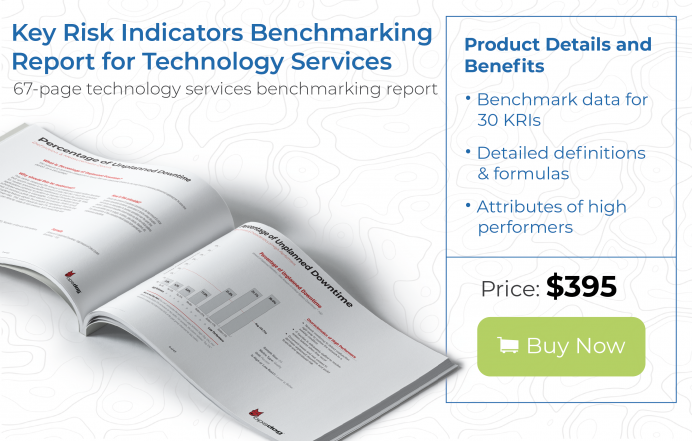
No matter the industry, key risk indicators for information technology can help bolster your business. For a full list of KRIs for benchmarking you can download our Technology Services Key Risk Indicator Benchmarking Report.
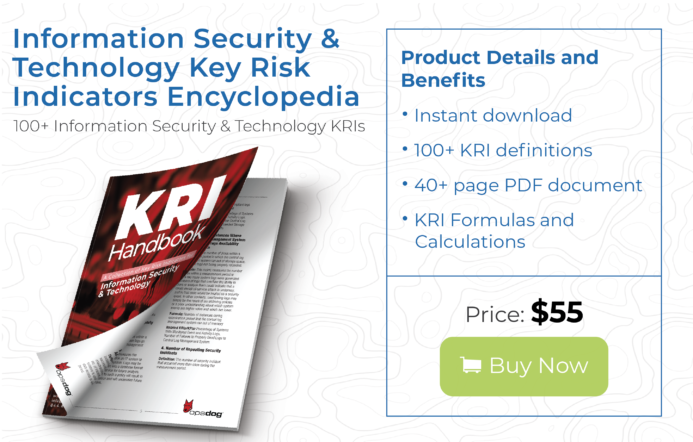
If your bank needs additional help benchmarking your IT risk or building a strong library of KRIs, then help yourself to our presentation-ready Risk Management KPI Encyclopedia. For even more assistance, contact us for more information about our benchmarking services. We can help you effectively and efficiently benchmark your technology services department and provide you with high-quality deliverables at an affordable price.