While external pressures such as economic conditions and the number of natural catastrophes can have a significant impact on the short-term profitability of insurance companies, insurers have plenty of opportunities to boost their long-term profitability by focusing on key performance indicators (KPIs). Measuring and then managing performance metrics inside an insurance KPI library can help insurers compete against peers, respond to market changes, attract customers, drive down loss ratios, and reduce costs.
What is an Insurance Key Performance Indicator (KPI)?
A insurance key performance indicator (KPI) can be defined as a quantitative or qualitative performance measurement related to the insurance industry that allows a company to evaluate processes, projects, and activities. KPIs enable insurers to measure how effectively they are achieving business goals. This is done by setting targets, and then using KPIs to measure progress toward those targets, KPIs allow insurers to make operational and process improvements.
What is an insurance KPI Library?
A key performance indicator (KPI) library is defined as a collection of KPIs, built on a foundation of understanding and research into an organization’s performance, focused on a specific industry. For insurance, an insurance KPI library is further categorized into specific business lines, such as property & casualty (P&C), life insurance, and auto insurance, as well as specific business functions such as agency operations, claims processing, and underwriting.
How to Build and Use a Key Performance Indicator Library
A KPI library is used to collect all of the performance metrics that an insurer is using all in one place. This makes it easy to locate a certain KPI and compare it to others also listed in the library. An insurance KPI library can be a powerful tool for measuring the success of an insurance company, as long as it is built carefully and constantly maintained as the company grows.
When beginning to build an insurance KPI library it is integral to ensure that the indicators chosen reflect the organization’s business practices. Choosing KPIs that are industry-standards without deep dive research into your own company, might negatively impact performance, as certain KPIs might not line up with department objectives.
It should also be mentioned that indicators within your insurance KPI library may change over time. As a department grows and changes, certain key performance indicators need to be exchanged for new metrics that better fit goals or objectives. KPI libraries are useful only as well as they are upkept, continuing to measure outdated metrics might do more harm than good.
Benefits of Insurance Key Performance Indicator Libraries
While premium growth is the bread-and-butter of insurance firms and directly impacts profitability, premiums don’t tell the entire profitability story. Also important is the amount that it costs insurance companies to operate and settle claims. Even if an insurer is writing a large number of policies, those profits can be eroded by high labor costs, poor underwriting, untrained employees, or customer turnover.
For example, KPIs can alert insurers to claims leakage due to claims management inefficiencies such as manual processes, paying too much for a claim, taking too long to settle a claim, or even highlight insurance fraud and bogus claims.
Moving the lever on KPIs may not require substantial changes or investment. Beefing up adjuster training, centralizing support functions, and making better use of existing technology can all add to profitability gains. When utilizing an insurance KPI library, these changes can be identified swiftly and corrected.
Examples of Key Performance Indicators for Insurance KPI Libraries
There are a wide variety of Key Performance Indicators (KPIs) that insurance companies can use to measure efficiency that will impact profitability. Below are a few of the most widely used performance metrics that can be found inside an insurance KPI library:
Insurance KPI library Example #1: Loss Ratio (P&C)
Insurance companies take loss ratio extremely seriously as it has a direct impact on an insurer’s market value and is a clear indicator of the health of the company. Loss ratio measures insurer profitability by dividing the total amount of P&C premiums the insurer collects over a given time period by the amount of insurance claims paid and how much it cost to investigate and settle those claims (loss adjustment expenses, or LAE).
Insurers can have a poor loss ratio due to high labor costs, subpar underwriting guidelines that onboards too many high risk policyholders, not estimating claims and adjustments properly, or taking too long to settle claims. A high loss ratio can also be caused by an increased number of claims due to natural disasters such as hurricanes.
Insurance KPI library Example #2: Underwriting Expense Ratio (P&C)
Other than claims paid, other factors that impact insurer profitability are costs to support sales, underwriting, and customer service. Underwriting expense ratio measures how operating costs impact profitability by comparing total company expenses to premiums earned. Unlike loss ratio, underwriting expense ratio does not include claims paid or LAE. High underwriting expense ratios could be indicative of ineffective sales, low producing employees, inefficient processes, and high customer attrition.
Insurance KPI library Example #3: Closed Claims per Adjuster (Auto)

Claims adjusters who investigate automobile insurance claims, determine insurer liability, and negotiate settlements are an integral part of the insurance company ecosystem—and can have a big impact on profitability. A measurement of adjuster productivity and possibly customer satisfaction, closed claims per adjuster is the total number of claims closed divided by the average number of adjusters over a set period of time. If adjuster productivity is low, insurers should consider improving adjuster training and documentation. Or, insurers can look to reduce staffing to lower claim closing costs.
Insurance KPI library Example #4: Claim Settlement Cycle Time (Life)
Since the amount of time it takes to settle claims impacts customer experience and loss control, the goal is to close life insurance claims as quickly as possible. Claim settlement cycle time measures the average number of days it takes from the time a customer reports a claim (first notice of loss, or FNOL) to the approval or denial of the claim. Insurers with a lengthy claim settlement time should look at how the company prioritize claims, whether customers are submitting claims with missing information, and whether adjusters need additional training.
Insurance KPI library Example #5: Cost per Claim (P&C)

Since insurers spend a large percentage of their total operating costs managing and settling claims, high cost per claim can be a significant drain on insurer profitability. By dividing the total operating cost of the P&C Claims Department by the total number of clams processed, insurers can measure the unit cost of each claim processed. While labor to handle data entry, estimates, adjustments, and other claim process tasks as well as technology costs are included in this metric, cost per claim does not include costs incurred by the insurer after a claim is closed. Armed with the cost per claim, insurers can better assess the risk of each policy type and adjust policy pricing to reflect that risk.
Final Thoughts & Insights
Many factors influence insurance company profitability, such as an increase in the number or severity of claims due to natural disasters such as hurricanes or wildfires. But much of insurers’ profitability is in their control. Insurers that use an insurance KPI library to track and measure expenses can then focus on how to make processes more efficient to lower costs. Those companies that can process a higher volume of claims with fewer errors and lessen the costs to sell, underwrite, onboard, and maintain customer policies can in turn invest those cost savings to further improve profitability.
Are you tasked with reducing and minimizing insurance claims leakage? Find out how to accelerate those efforts here!
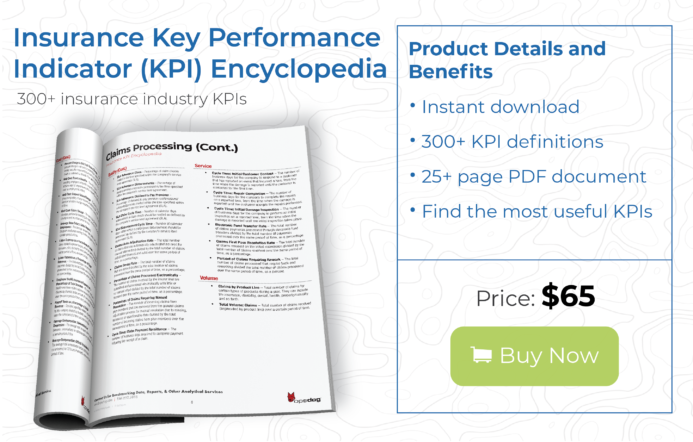
There are many key performance indicators to consider while building an insurance KPI library, for a full list of insurance performance metrics download our Insurance Key Performance Indicator Encyclopedia.
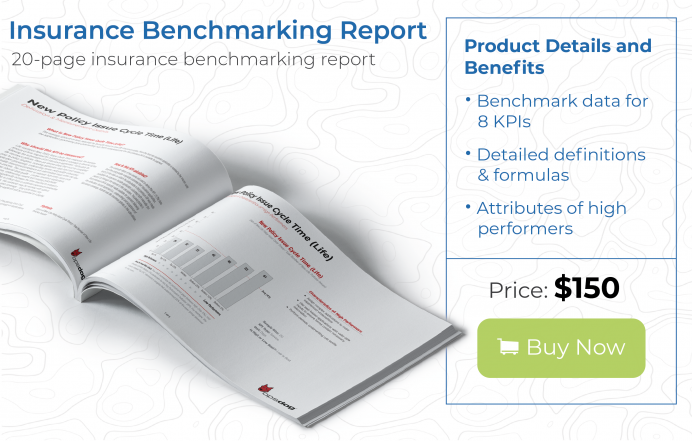
If you need additional help benchmarking against your peers or building a strong KPI library, then help yourself to our presentation-ready Insurance benchmarking reports, or contact us for more information about our https://opsdog.com/services/benchmarking. We can help you quickly and efficiently benchmark your insurance company and provide you with high-quality deliverables perfect for presentations at an affordable price.