What are Investment Management KPIs?
Investment management firms – similar to broker dealers, or investment banks – are responsible for managing and growing client assets. In addition to attracting new clients, asset managers must effectively service existing assets and work to maximize return on investment throughout their portfolio. Investment management KPIs may measure investment performance (e.g., Return on Assets, etc.), as well as the efficiency of the firm in executing trades, servicing client assets, on-boarding new accounts and managing online trading platforms.
Using KPIs to Measure Asset Management Sales and Operations
A typical asset or investment management firm can be divided into three major parts. The front office interacts with new and existing clients to develop relationships and provide financial advice. The middle office on-boards new accounts and manages trade activity. The back office provides trade support, financial reporting and other technical support for the firm. KPIs should measure performance within, and across, these three major groups – and not only in terms of investment performance. Efficiently managing trades and providing quality client service help the firm grow its earnings and client base.
Investment Management Metrics: The Top 6 for Operations
There are plenty of metrics for measuring investment performance and market trends. KPIs for monitoring investment management and asset management firm operations, however, are less well-defined. Here are 6 KPIs that can be used to measure operational efficiency for asset managers:
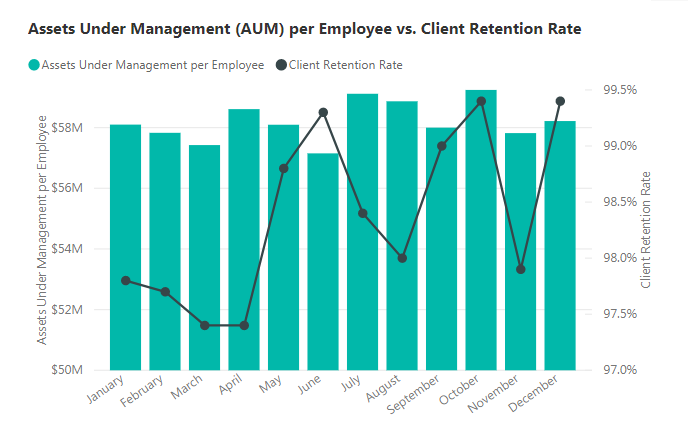
- 1.Assets Under Management (AUM) per Employee
- 2.Client Retention Rate
- 3.Clients per Registered Financial Advisor
- 4.Account On-Boarding Cycle Time
- 5.Trade Error Rate (by Asset Class/Type)
- 6.Trade Settlements per Back Office Employee
Buy Investment Management KPI Benchmarking “Data-as-a-Service” Products from Opsdog
Opsdog.com sells Investment Management KPI and benchmarking data in three different ways.
- Comprehensive Investment Management KPI benchmarking reports bundles that include 10 to 80+ measured KPIs.
- Price range is from $750-$2000 per report
- Instant download
-
Individual Investment Management KPI benchmarks that contain 1 benchmarked KPI –
- Price range is $50-$65 per individual benchmarked KPI
- Instant download
-
Custom Investment Management benchmarking KPI Data-as-a-Service projects and consulting engagements
- 3-10 week long KPI benchmarking projects
- Price varies based on scope
- Hybrid on-site/off-site low-cost model
Browse Instant Download Investment Management KPI and Benchmarking Products for Purchase Below
Fortune 1000 customers are over the moon about OpsDog business intelligence!

Blow away your boss with business intelligence KPI dashboards!
Take a bite out of inefficiency with custom business intelligence from OpsDog

Select an industry.
-
Support Group Operations
-- 344Finance
- 245Human Resources
- 230Information Technology
- 372Marketing
- 70Legal
- 93Compliance
- 165Shared Services
- 16Risk Management
-
General Line Groups
-- 150Call Center
- 150Customer Service
- 162Product Development
- 102Collections
- 300Sales
-
Supply Chain Operations
- -
Financial Services
-- 966Banking
- 229Insurance
- 130Mortgage Lending
- 428Investment Management
- 445Broker Dealer
- 235Consumer Finance
-
Healthcare
- -
Other Services
-- 118Utilities
- 65Print Publishing
- 68Broadcast Media
- 263Advertising
- 90Retail
Let us take your KPIs & business intelligence efforts to the top.